Mongolian vs Armenian 7th Grade
COMPARE
Mongolian
Armenian
7th Grade
7th Grade Comparison
Mongolians
Armenians
96.0%
7TH GRADE
50.0/ 100
METRIC RATING
174th/ 347
METRIC RANK
95.0%
7TH GRADE
0.1/ 100
METRIC RATING
284th/ 347
METRIC RANK
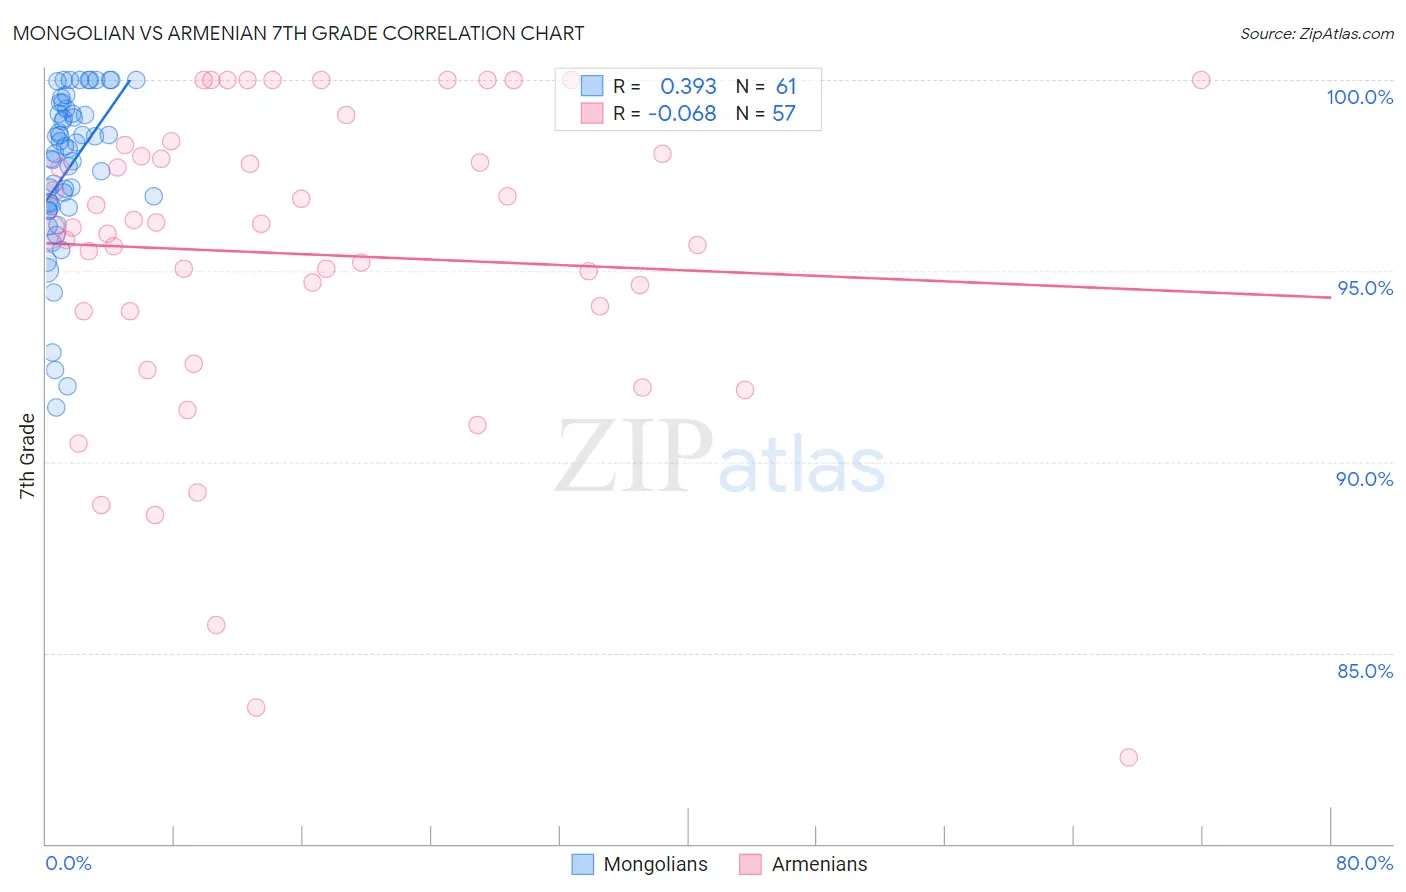
Mongolian vs Armenian 7th Grade Correlation Chart
The statistical analysis conducted on geographies consisting of 140,362,004 people shows a mild positive correlation between the proportion of Mongolians and percentage of population with at least 7th grade education in the United States with a correlation coefficient (R) of 0.393 and weighted average of 96.0%. Similarly, the statistical analysis conducted on geographies consisting of 310,954,801 people shows a slight negative correlation between the proportion of Armenians and percentage of population with at least 7th grade education in the United States with a correlation coefficient (R) of -0.068 and weighted average of 95.0%, a difference of 1.1%.
7th Grade Correlation Summary
| Measurement | Mongolian | Armenian |
| Minimum | 91.4% | 82.3% |
| Maximum | 100.0% | 100.0% |
| Range | 8.6% | 17.7% |
| Mean | 97.7% | 95.4% |
| Median | 98.2% | 96.1% |
| Interquartile 25% (IQ1) | 96.7% | 94.0% |
| Interquartile 75% (IQ3) | 99.2% | 98.2% |
| Interquartile Range (IQR) | 2.5% | 4.2% |
| Standard Deviation (Sample) | 2.1% | 4.1% |
| Standard Deviation (Population) | 2.0% | 4.1% |
Similar Demographics by 7th Grade
Demographics Similar to Mongolians by 7th Grade
In terms of 7th grade, the demographic groups most similar to Mongolians are Immigrants from Albania (96.0%, a difference of 0.0%), Black/African American (96.0%, a difference of 0.0%), Chilean (96.0%, a difference of 0.0%), Venezuelan (96.0%, a difference of 0.010%), and Immigrants from Korea (96.0%, a difference of 0.010%).
| Demographics | Rating | Rank | 7th Grade |
| Immigrants | Sri Lanka | 59.9 /100 | #167 | Average 96.1% |
| Immigrants | Poland | 59.0 /100 | #168 | Average 96.1% |
| Ute | 55.8 /100 | #169 | Average 96.1% |
| Immigrants | Ukraine | 55.0 /100 | #170 | Average 96.1% |
| Egyptians | 54.2 /100 | #171 | Average 96.1% |
| Venezuelans | 51.4 /100 | #172 | Average 96.0% |
| Immigrants | Albania | 50.4 /100 | #173 | Average 96.0% |
| Mongolians | 50.0 /100 | #174 | Average 96.0% |
| Blacks/African Americans | 49.5 /100 | #175 | Average 96.0% |
| Chileans | 49.3 /100 | #176 | Average 96.0% |
| Immigrants | Korea | 49.2 /100 | #177 | Average 96.0% |
| Marshallese | 48.4 /100 | #178 | Average 96.0% |
| Immigrants | Iran | 47.8 /100 | #179 | Average 96.0% |
| Immigrants | Brazil | 46.8 /100 | #180 | Average 96.0% |
| Pakistanis | 44.5 /100 | #181 | Average 96.0% |
Demographics Similar to Armenians by 7th Grade
In terms of 7th grade, the demographic groups most similar to Armenians are Immigrants from Barbados (95.0%, a difference of 0.0%), Immigrants from Eritrea (94.9%, a difference of 0.010%), Immigrants from Bolivia (95.0%, a difference of 0.060%), Immigrants from St. Vincent and the Grenadines (95.0%, a difference of 0.070%), and Tohono O'odham (95.0%, a difference of 0.070%).
| Demographics | Rating | Rank | 7th Grade |
| Immigrants | Afghanistan | 0.2 /100 | #277 | Tragic 95.1% |
| Immigrants | Trinidad and Tobago | 0.1 /100 | #278 | Tragic 95.1% |
| Barbadians | 0.1 /100 | #279 | Tragic 95.1% |
| Immigrants | St. Vincent and the Grenadines | 0.1 /100 | #280 | Tragic 95.0% |
| Tohono O'odham | 0.1 /100 | #281 | Tragic 95.0% |
| Immigrants | Bolivia | 0.1 /100 | #282 | Tragic 95.0% |
| Immigrants | Barbados | 0.1 /100 | #283 | Tragic 95.0% |
| Armenians | 0.1 /100 | #284 | Tragic 95.0% |
| Immigrants | Eritrea | 0.1 /100 | #285 | Tragic 94.9% |
| Immigrants | Philippines | 0.0 /100 | #286 | Tragic 94.9% |
| Immigrants | Peru | 0.0 /100 | #287 | Tragic 94.9% |
| British West Indians | 0.0 /100 | #288 | Tragic 94.8% |
| Taiwanese | 0.0 /100 | #289 | Tragic 94.8% |
| Malaysians | 0.0 /100 | #290 | Tragic 94.8% |
| Immigrants | Grenada | 0.0 /100 | #291 | Tragic 94.8% |