Mongolian vs Armenian Master's Degree
COMPARE
Mongolian
Armenian
Master's Degree
Master's Degree Comparison
Mongolians
Armenians
19.4%
MASTER'S DEGREE
100.0/ 100
METRIC RATING
37th/ 347
METRIC RANK
16.8%
MASTER'S DEGREE
98.0/ 100
METRIC RATING
107th/ 347
METRIC RANK
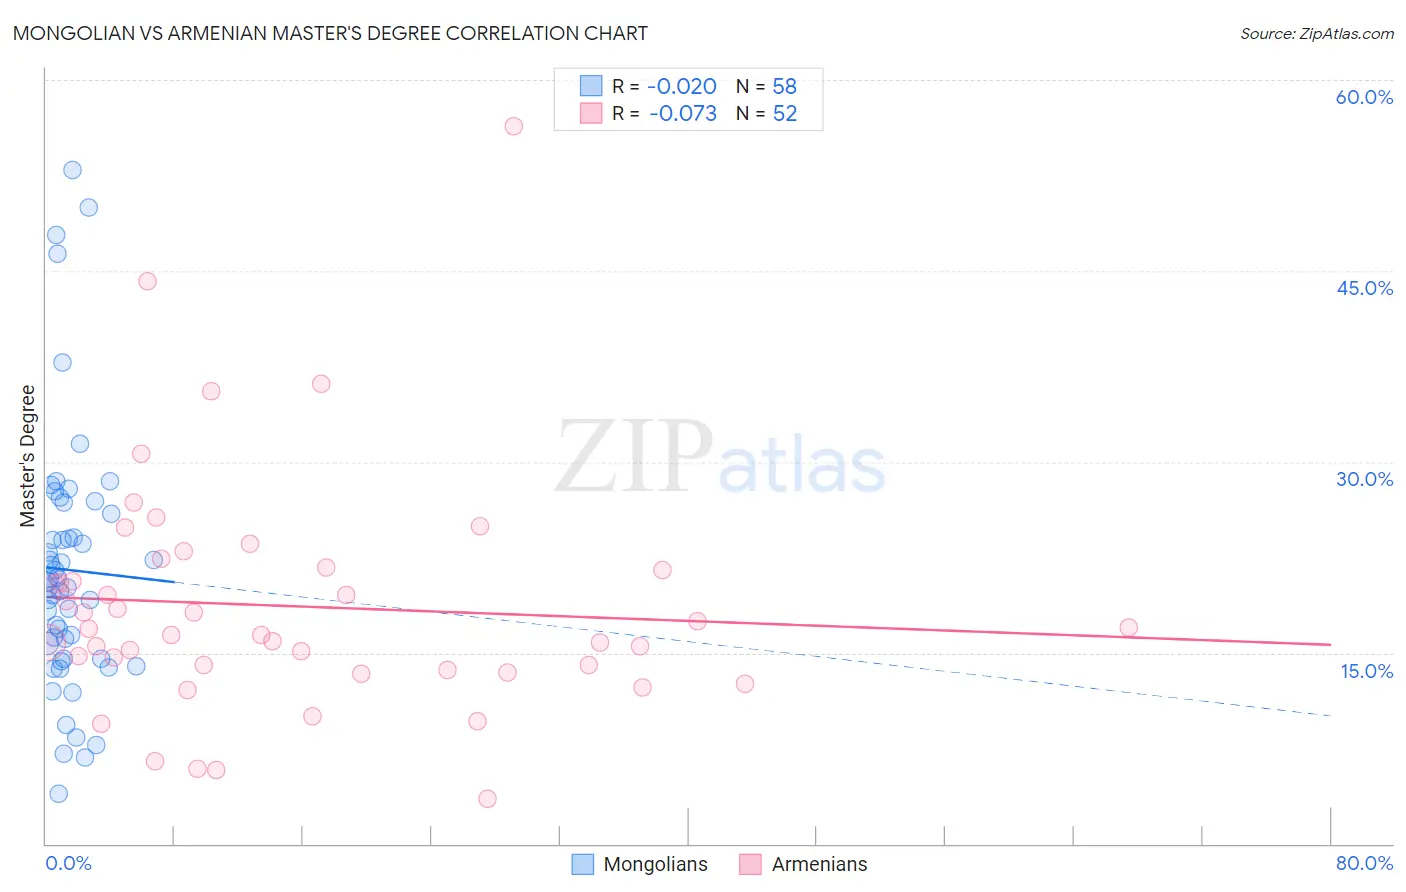
Mongolian vs Armenian Master's Degree Correlation Chart
The statistical analysis conducted on geographies consisting of 140,335,319 people shows no correlation between the proportion of Mongolians and percentage of population with at least master's degree education in the United States with a correlation coefficient (R) of -0.020 and weighted average of 19.4%. Similarly, the statistical analysis conducted on geographies consisting of 310,885,780 people shows a slight negative correlation between the proportion of Armenians and percentage of population with at least master's degree education in the United States with a correlation coefficient (R) of -0.073 and weighted average of 16.8%, a difference of 15.6%.
Master's Degree Correlation Summary
| Measurement | Mongolian | Armenian |
| Minimum | 3.9% | 3.6% |
| Maximum | 53.0% | 56.3% |
| Range | 49.0% | 52.8% |
| Mean | 21.5% | 18.7% |
| Median | 20.4% | 16.7% |
| Interquartile 25% (IQ1) | 14.5% | 13.8% |
| Interquartile 75% (IQ3) | 26.0% | 21.6% |
| Interquartile Range (IQR) | 11.4% | 7.7% |
| Standard Deviation (Sample) | 10.1% | 9.3% |
| Standard Deviation (Population) | 10.0% | 9.2% |
Similar Demographics by Master's Degree
Demographics Similar to Mongolians by Master's Degree
In terms of master's degree, the demographic groups most similar to Mongolians are Immigrants from Russia (19.4%, a difference of 0.040%), Immigrants from Northern Europe (19.5%, a difference of 0.41%), Bolivian (19.3%, a difference of 0.69%), Immigrants from Denmark (19.5%, a difference of 0.74%), and Russian (19.5%, a difference of 0.77%).
| Demographics | Rating | Rank | Master's Degree |
| Immigrants | Turkey | 100.0 /100 | #30 | Exceptional 19.7% |
| Immigrants | Korea | 100.0 /100 | #31 | Exceptional 19.7% |
| Burmese | 100.0 /100 | #32 | Exceptional 19.7% |
| Russians | 100.0 /100 | #33 | Exceptional 19.5% |
| Immigrants | Denmark | 100.0 /100 | #34 | Exceptional 19.5% |
| Immigrants | Northern Europe | 100.0 /100 | #35 | Exceptional 19.5% |
| Immigrants | Russia | 100.0 /100 | #36 | Exceptional 19.4% |
| Mongolians | 100.0 /100 | #37 | Exceptional 19.4% |
| Bolivians | 100.0 /100 | #38 | Exceptional 19.3% |
| Immigrants | Spain | 100.0 /100 | #39 | Exceptional 19.1% |
| Immigrants | Bolivia | 100.0 /100 | #40 | Exceptional 19.1% |
| Immigrants | Latvia | 100.0 /100 | #41 | Exceptional 19.1% |
| Immigrants | Saudi Arabia | 100.0 /100 | #42 | Exceptional 19.0% |
| Immigrants | Greece | 100.0 /100 | #43 | Exceptional 19.0% |
| Immigrants | Malaysia | 100.0 /100 | #44 | Exceptional 18.9% |
Demographics Similar to Armenians by Master's Degree
In terms of master's degree, the demographic groups most similar to Armenians are Sierra Leonean (16.8%, a difference of 0.030%), Moroccan (16.8%, a difference of 0.050%), Immigrants from Chile (16.8%, a difference of 0.080%), Immigrants from Albania (16.8%, a difference of 0.090%), and Austrian (16.7%, a difference of 0.35%).
| Demographics | Rating | Rank | Master's Degree |
| Albanians | 98.7 /100 | #100 | Exceptional 17.0% |
| Immigrants | Nepal | 98.6 /100 | #101 | Exceptional 17.0% |
| Chileans | 98.6 /100 | #102 | Exceptional 16.9% |
| Alsatians | 98.4 /100 | #103 | Exceptional 16.9% |
| Ukrainians | 98.3 /100 | #104 | Exceptional 16.9% |
| Syrians | 98.3 /100 | #105 | Exceptional 16.8% |
| Immigrants | Albania | 98.1 /100 | #106 | Exceptional 16.8% |
| Armenians | 98.0 /100 | #107 | Exceptional 16.8% |
| Sierra Leoneans | 98.0 /100 | #108 | Exceptional 16.8% |
| Moroccans | 98.0 /100 | #109 | Exceptional 16.8% |
| Immigrants | Chile | 98.0 /100 | #110 | Exceptional 16.8% |
| Austrians | 97.8 /100 | #111 | Exceptional 16.7% |
| Macedonians | 97.7 /100 | #112 | Exceptional 16.7% |
| Arabs | 97.7 /100 | #113 | Exceptional 16.7% |
| Northern Europeans | 97.6 /100 | #114 | Exceptional 16.7% |