Navajo vs Armenian Median Female Earnings
COMPARE
Navajo
Armenian
Median Female Earnings
Median Female Earnings Comparison
Navajo
Armenians
$33,046
MEDIAN FEMALE EARNINGS
0.0/ 100
METRIC RATING
341st/ 347
METRIC RANK
$42,212
MEDIAN FEMALE EARNINGS
99.5/ 100
METRIC RATING
84th/ 347
METRIC RANK
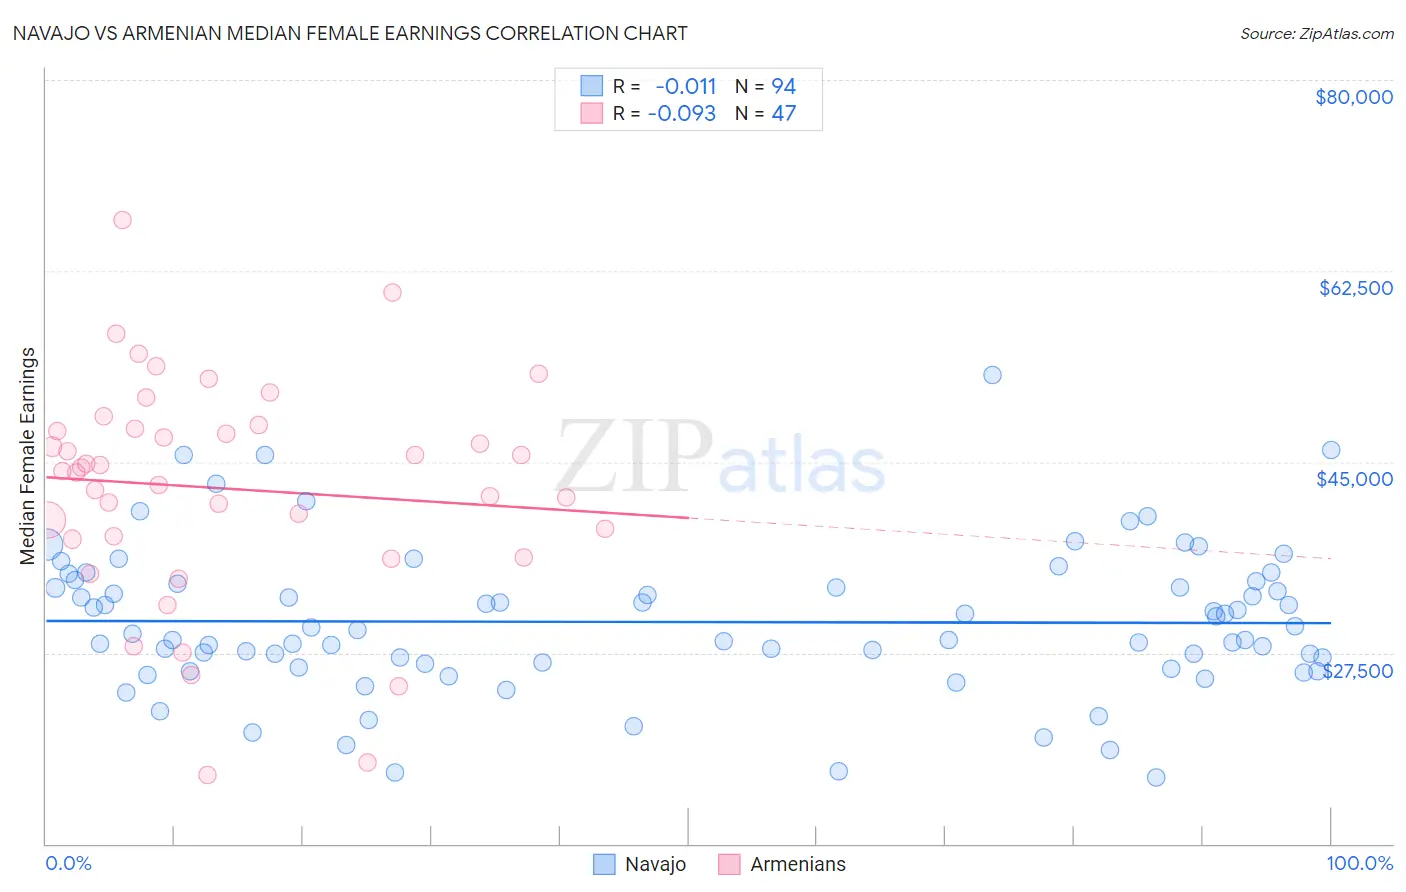
Navajo vs Armenian Median Female Earnings Correlation Chart
The statistical analysis conducted on geographies consisting of 224,729,121 people shows no correlation between the proportion of Navajo and median female earnings in the United States with a correlation coefficient (R) of -0.011 and weighted average of $33,046. Similarly, the statistical analysis conducted on geographies consisting of 310,826,336 people shows a slight negative correlation between the proportion of Armenians and median female earnings in the United States with a correlation coefficient (R) of -0.093 and weighted average of $42,212, a difference of 27.7%.
Median Female Earnings Correlation Summary
| Measurement | Navajo | Armenian |
| Minimum | $16,070 | $16,250 |
| Maximum | $52,969 | $67,117 |
| Range | $36,899 | $50,867 |
| Mean | $30,327 | $42,561 |
| Median | $29,421 | $44,186 |
| Interquartile 25% (IQ1) | $26,466 | $37,899 |
| Interquartile 75% (IQ3) | $33,883 | $48,091 |
| Interquartile Range (IQR) | $7,417 | $10,192 |
| Standard Deviation (Sample) | $6,718 | $10,212 |
| Standard Deviation (Population) | $6,682 | $10,102 |
Similar Demographics by Median Female Earnings
Demographics Similar to Navajo by Median Female Earnings
In terms of median female earnings, the demographic groups most similar to Navajo are Tohono O'odham ($33,205, a difference of 0.48%), Immigrants from Mexico ($33,236, a difference of 0.57%), Immigrants from Cuba ($33,291, a difference of 0.74%), Yakama ($33,354, a difference of 0.93%), and Yup'ik ($32,730, a difference of 0.96%).
| Demographics | Rating | Rank | Median Female Earnings |
| Mexicans | 0.0 /100 | #333 | Tragic $33,664 |
| Spanish American Indians | 0.0 /100 | #334 | Tragic $33,625 |
| Creek | 0.0 /100 | #335 | Tragic $33,437 |
| Ottawa | 0.0 /100 | #336 | Tragic $33,378 |
| Yakama | 0.0 /100 | #337 | Tragic $33,354 |
| Immigrants | Cuba | 0.0 /100 | #338 | Tragic $33,291 |
| Immigrants | Mexico | 0.0 /100 | #339 | Tragic $33,236 |
| Tohono O'odham | 0.0 /100 | #340 | Tragic $33,205 |
| Navajo | 0.0 /100 | #341 | Tragic $33,046 |
| Yup'ik | 0.0 /100 | #342 | Tragic $32,730 |
| Pueblo | 0.0 /100 | #343 | Tragic $32,564 |
| Lumbee | 0.0 /100 | #344 | Tragic $32,500 |
| Puerto Ricans | 0.0 /100 | #345 | Tragic $31,560 |
| Arapaho | 0.0 /100 | #346 | Tragic $31,489 |
| Houma | 0.0 /100 | #347 | Tragic $30,343 |
Demographics Similar to Armenians by Median Female Earnings
In terms of median female earnings, the demographic groups most similar to Armenians are Immigrants from Sierra Leone ($42,214, a difference of 0.010%), Immigrants from Morocco ($42,229, a difference of 0.040%), Immigrants from Southern Europe ($42,275, a difference of 0.15%), Laotian ($42,133, a difference of 0.19%), and Immigrants from Moldova ($42,304, a difference of 0.22%).
| Demographics | Rating | Rank | Median Female Earnings |
| Immigrants | Albania | 99.6 /100 | #77 | Exceptional $42,388 |
| Immigrants | Kazakhstan | 99.6 /100 | #78 | Exceptional $42,386 |
| Greeks | 99.6 /100 | #79 | Exceptional $42,336 |
| Immigrants | Moldova | 99.6 /100 | #80 | Exceptional $42,304 |
| Immigrants | Southern Europe | 99.5 /100 | #81 | Exceptional $42,275 |
| Immigrants | Morocco | 99.5 /100 | #82 | Exceptional $42,229 |
| Immigrants | Sierra Leone | 99.5 /100 | #83 | Exceptional $42,214 |
| Armenians | 99.5 /100 | #84 | Exceptional $42,212 |
| Laotians | 99.4 /100 | #85 | Exceptional $42,133 |
| Immigrants | St. Vincent and the Grenadines | 99.3 /100 | #86 | Exceptional $42,108 |
| Lithuanians | 99.3 /100 | #87 | Exceptional $42,108 |
| Immigrants | Northern Africa | 99.3 /100 | #88 | Exceptional $42,084 |
| Immigrants | Afghanistan | 99.3 /100 | #89 | Exceptional $42,055 |
| Ukrainians | 99.2 /100 | #90 | Exceptional $42,015 |
| Immigrants | Western Europe | 99.2 /100 | #91 | Exceptional $41,990 |