French Canadian vs Immigrants from Micronesia Householder Income Over 65 years
COMPARE
French Canadian
Immigrants from Micronesia
Householder Income Over 65 years
Householder Income Over 65 years Comparison
French Canadians
Immigrants from Micronesia
$57,975
HOUSEHOLDER INCOME OVER 65 YEARS
4.2/ 100
METRIC RATING
226th/ 347
METRIC RANK
$61,000
HOUSEHOLDER INCOME OVER 65 YEARS
50.8/ 100
METRIC RATING
173rd/ 347
METRIC RANK
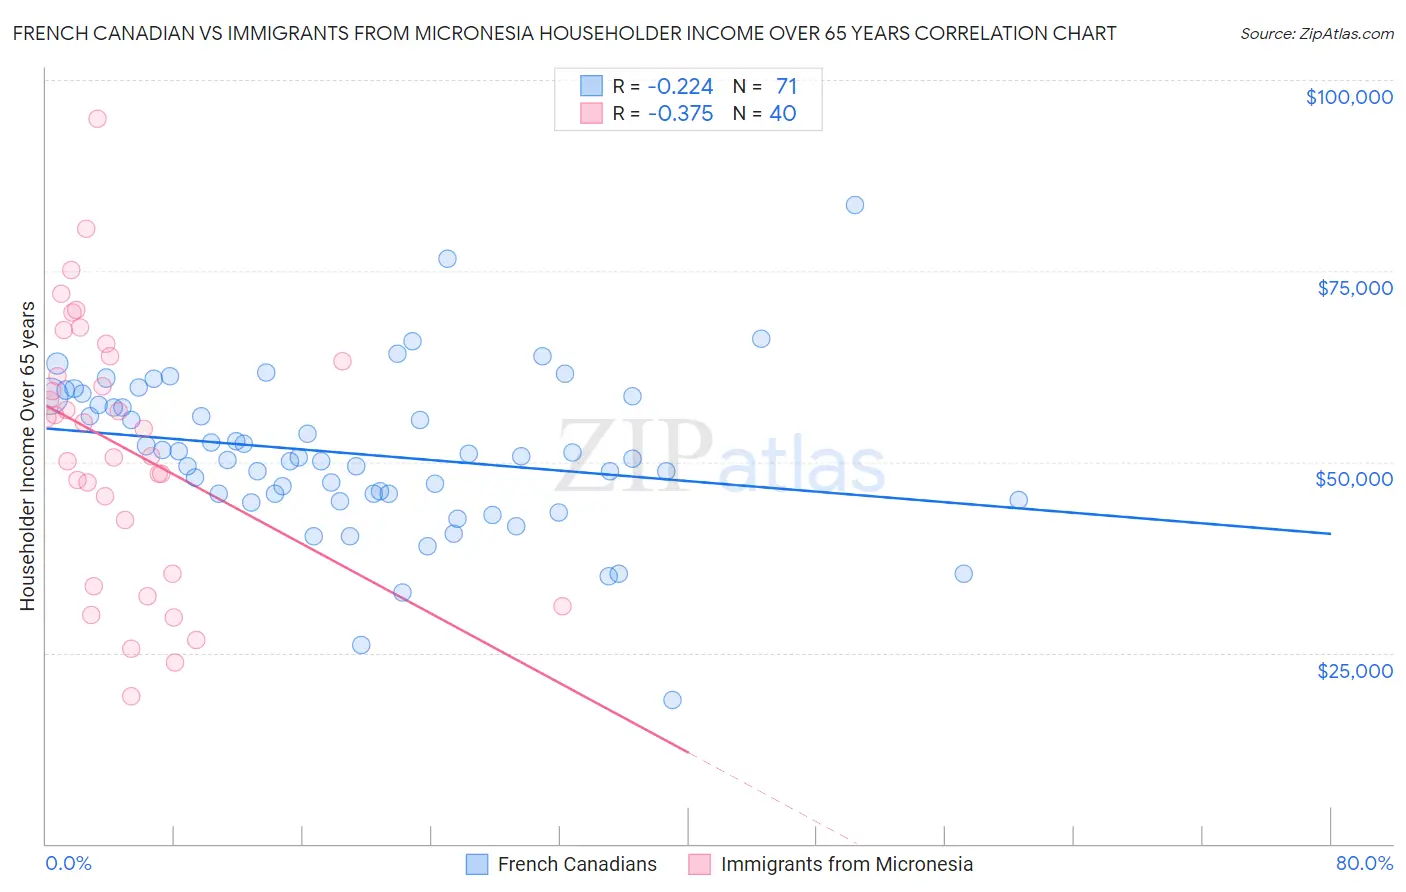
French Canadian vs Immigrants from Micronesia Householder Income Over 65 years Correlation Chart
The statistical analysis conducted on geographies consisting of 499,919,017 people shows a weak negative correlation between the proportion of French Canadians and household income with householder over the age of 65 in the United States with a correlation coefficient (R) of -0.224 and weighted average of $57,975. Similarly, the statistical analysis conducted on geographies consisting of 61,368,968 people shows a mild negative correlation between the proportion of Immigrants from Micronesia and household income with householder over the age of 65 in the United States with a correlation coefficient (R) of -0.375 and weighted average of $61,000, a difference of 5.2%.
Householder Income Over 65 years Correlation Summary
| Measurement | French Canadian | Immigrants from Micronesia |
| Minimum | $18,750 | $19,375 |
| Maximum | $83,631 | $94,868 |
| Range | $64,881 | $75,493 |
| Mean | $51,013 | $52,032 |
| Median | $50,515 | $54,757 |
| Interquartile 25% (IQ1) | $45,820 | $38,889 |
| Interquartile 75% (IQ3) | $58,631 | $63,458 |
| Interquartile Range (IQR) | $12,810 | $24,569 |
| Standard Deviation (Sample) | $10,428 | $17,019 |
| Standard Deviation (Population) | $10,355 | $16,805 |
Similar Demographics by Householder Income Over 65 years
Demographics Similar to French Canadians by Householder Income Over 65 years
In terms of householder income over 65 years, the demographic groups most similar to French Canadians are Venezuelan ($58,026, a difference of 0.090%), Japanese ($57,919, a difference of 0.10%), Immigrants from Albania ($57,828, a difference of 0.25%), Bermudan ($58,171, a difference of 0.34%), and Tsimshian ($58,202, a difference of 0.39%).
| Demographics | Rating | Rank | Householder Income Over 65 years |
| Malaysians | 5.5 /100 | #219 | Tragic $58,244 |
| Yugoslavians | 5.5 /100 | #220 | Tragic $58,243 |
| Immigrants | El Salvador | 5.4 /100 | #221 | Tragic $58,226 |
| Delaware | 5.3 /100 | #222 | Tragic $58,214 |
| Tsimshian | 5.2 /100 | #223 | Tragic $58,202 |
| Bermudans | 5.1 /100 | #224 | Tragic $58,171 |
| Venezuelans | 4.4 /100 | #225 | Tragic $58,026 |
| French Canadians | 4.2 /100 | #226 | Tragic $57,975 |
| Japanese | 3.9 /100 | #227 | Tragic $57,919 |
| Immigrants | Albania | 3.6 /100 | #228 | Tragic $57,828 |
| Immigrants | Colombia | 3.0 /100 | #229 | Tragic $57,658 |
| Immigrants | Cambodia | 2.8 /100 | #230 | Tragic $57,580 |
| Immigrants | Nonimmigrants | 2.4 /100 | #231 | Tragic $57,426 |
| Immigrants | Venezuela | 2.3 /100 | #232 | Tragic $57,371 |
| Immigrants | Western Africa | 1.7 /100 | #233 | Tragic $57,119 |
Demographics Similar to Immigrants from Micronesia by Householder Income Over 65 years
In terms of householder income over 65 years, the demographic groups most similar to Immigrants from Micronesia are Luxembourger ($60,967, a difference of 0.050%), Immigrants from Poland ($61,041, a difference of 0.070%), Inupiat ($61,061, a difference of 0.10%), Serbian ($61,087, a difference of 0.14%), and Carpatho Rusyn ($61,093, a difference of 0.15%).
| Demographics | Rating | Rank | Householder Income Over 65 years |
| Immigrants | Eastern Africa | 55.0 /100 | #166 | Average $61,157 |
| Norwegians | 53.6 /100 | #167 | Average $61,104 |
| Irish | 53.4 /100 | #168 | Average $61,097 |
| Carpatho Rusyns | 53.3 /100 | #169 | Average $61,093 |
| Serbians | 53.1 /100 | #170 | Average $61,087 |
| Inupiat | 52.4 /100 | #171 | Average $61,061 |
| Immigrants | Poland | 51.9 /100 | #172 | Average $61,041 |
| Immigrants | Micronesia | 50.8 /100 | #173 | Average $61,000 |
| Luxembourgers | 50.0 /100 | #174 | Average $60,967 |
| Spaniards | 47.3 /100 | #175 | Average $60,866 |
| Spanish | 45.5 /100 | #176 | Average $60,795 |
| Alaska Natives | 44.3 /100 | #177 | Average $60,748 |
| Yup'ik | 43.7 /100 | #178 | Average $60,727 |
| Welsh | 42.2 /100 | #179 | Average $60,666 |
| Immigrants | Morocco | 41.7 /100 | #180 | Average $60,647 |