Immigrants from Bosnia and Herzegovina vs Immigrants from Micronesia Householder Income Over 65 years
COMPARE
Immigrants from Bosnia and Herzegovina
Immigrants from Micronesia
Householder Income Over 65 years
Householder Income Over 65 years Comparison
Immigrants from Bosnia and Herzegovina
Immigrants from Micronesia
$55,986
HOUSEHOLDER INCOME OVER 65 YEARS
0.5/ 100
METRIC RATING
250th/ 347
METRIC RANK
$61,000
HOUSEHOLDER INCOME OVER 65 YEARS
50.8/ 100
METRIC RATING
173rd/ 347
METRIC RANK
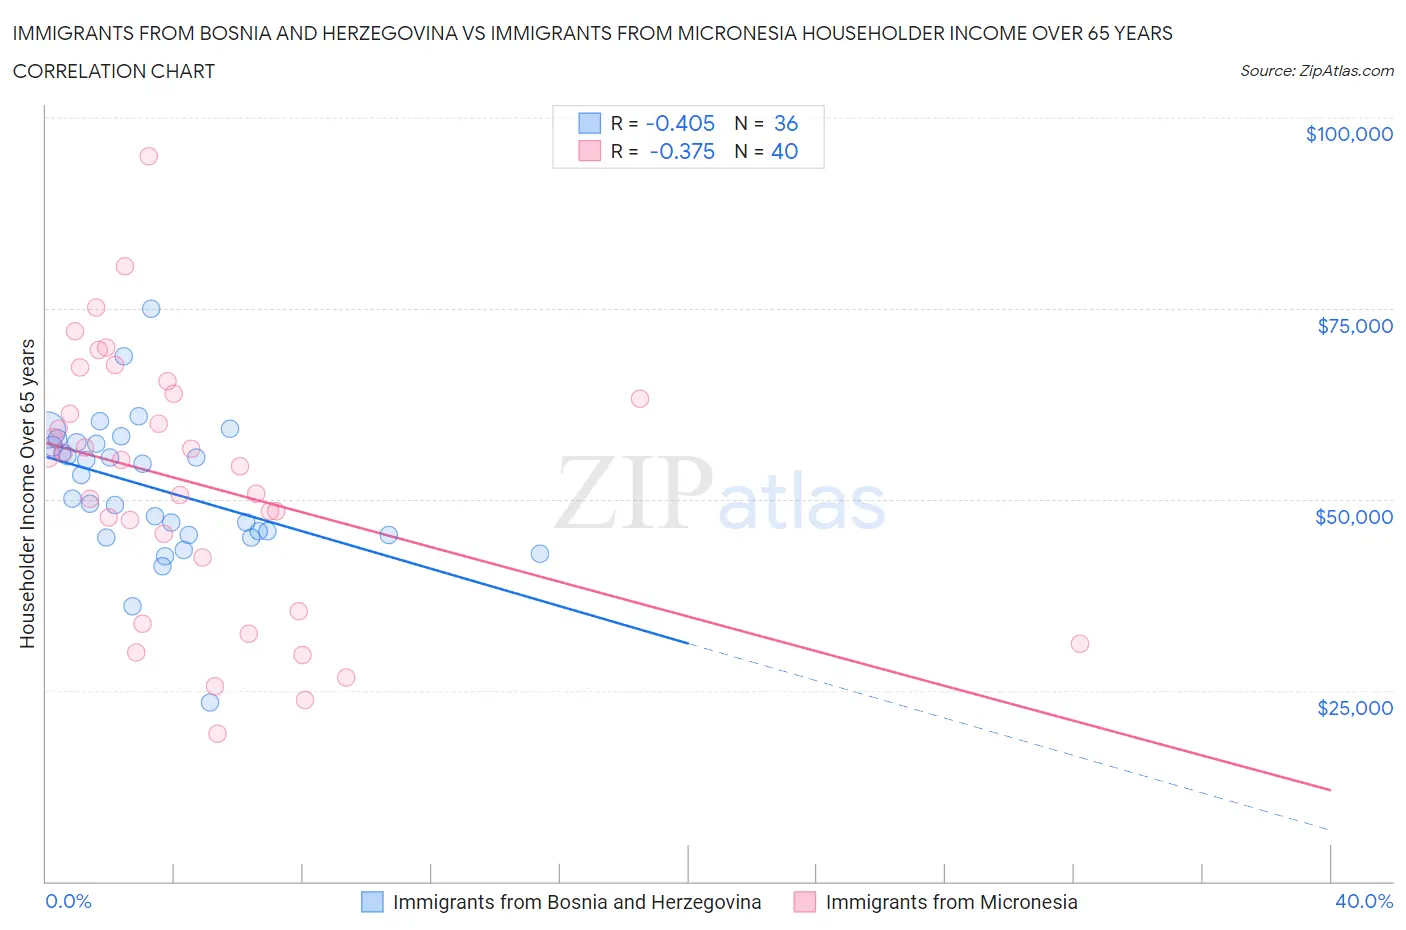
Immigrants from Bosnia and Herzegovina vs Immigrants from Micronesia Householder Income Over 65 years Correlation Chart
The statistical analysis conducted on geographies consisting of 156,709,633 people shows a moderate negative correlation between the proportion of Immigrants from Bosnia and Herzegovina and household income with householder over the age of 65 in the United States with a correlation coefficient (R) of -0.405 and weighted average of $55,986. Similarly, the statistical analysis conducted on geographies consisting of 61,368,968 people shows a mild negative correlation between the proportion of Immigrants from Micronesia and household income with householder over the age of 65 in the United States with a correlation coefficient (R) of -0.375 and weighted average of $61,000, a difference of 9.0%.
Householder Income Over 65 years Correlation Summary
| Measurement | Immigrants from Bosnia and Herzegovina | Immigrants from Micronesia |
| Minimum | $23,391 | $19,375 |
| Maximum | $74,953 | $94,868 |
| Range | $51,562 | $75,493 |
| Mean | $51,359 | $52,032 |
| Median | $51,669 | $54,757 |
| Interquartile 25% (IQ1) | $45,302 | $38,889 |
| Interquartile 75% (IQ3) | $57,366 | $63,458 |
| Interquartile Range (IQR) | $12,064 | $24,569 |
| Standard Deviation (Sample) | $9,347 | $17,019 |
| Standard Deviation (Population) | $9,217 | $16,805 |
Similar Demographics by Householder Income Over 65 years
Demographics Similar to Immigrants from Bosnia and Herzegovina by Householder Income Over 65 years
In terms of householder income over 65 years, the demographic groups most similar to Immigrants from Bosnia and Herzegovina are Immigrants from Portugal ($55,924, a difference of 0.11%), Mexican American Indian ($56,089, a difference of 0.19%), Vietnamese ($56,143, a difference of 0.28%), Yakama ($56,234, a difference of 0.44%), and Osage ($55,677, a difference of 0.55%).
| Demographics | Rating | Rank | Householder Income Over 65 years |
| Guyanese | 0.8 /100 | #243 | Tragic $56,351 |
| Hmong | 0.8 /100 | #244 | Tragic $56,339 |
| Immigrants | Uzbekistan | 0.8 /100 | #245 | Tragic $56,331 |
| Central Americans | 0.8 /100 | #246 | Tragic $56,321 |
| Yakama | 0.7 /100 | #247 | Tragic $56,234 |
| Vietnamese | 0.6 /100 | #248 | Tragic $56,143 |
| Mexican American Indians | 0.6 /100 | #249 | Tragic $56,089 |
| Immigrants | Bosnia and Herzegovina | 0.5 /100 | #250 | Tragic $55,986 |
| Immigrants | Portugal | 0.5 /100 | #251 | Tragic $55,924 |
| Osage | 0.4 /100 | #252 | Tragic $55,677 |
| Immigrants | Trinidad and Tobago | 0.4 /100 | #253 | Tragic $55,598 |
| Americans | 0.3 /100 | #254 | Tragic $55,527 |
| Immigrants | Bangladesh | 0.3 /100 | #255 | Tragic $55,394 |
| German Russians | 0.3 /100 | #256 | Tragic $55,356 |
| Trinidadians and Tobagonians | 0.3 /100 | #257 | Tragic $55,327 |
Demographics Similar to Immigrants from Micronesia by Householder Income Over 65 years
In terms of householder income over 65 years, the demographic groups most similar to Immigrants from Micronesia are Luxembourger ($60,967, a difference of 0.050%), Immigrants from Poland ($61,041, a difference of 0.070%), Inupiat ($61,061, a difference of 0.10%), Serbian ($61,087, a difference of 0.14%), and Carpatho Rusyn ($61,093, a difference of 0.15%).
| Demographics | Rating | Rank | Householder Income Over 65 years |
| Immigrants | Eastern Africa | 55.0 /100 | #166 | Average $61,157 |
| Norwegians | 53.6 /100 | #167 | Average $61,104 |
| Irish | 53.4 /100 | #168 | Average $61,097 |
| Carpatho Rusyns | 53.3 /100 | #169 | Average $61,093 |
| Serbians | 53.1 /100 | #170 | Average $61,087 |
| Inupiat | 52.4 /100 | #171 | Average $61,061 |
| Immigrants | Poland | 51.9 /100 | #172 | Average $61,041 |
| Immigrants | Micronesia | 50.8 /100 | #173 | Average $61,000 |
| Luxembourgers | 50.0 /100 | #174 | Average $60,967 |
| Spaniards | 47.3 /100 | #175 | Average $60,866 |
| Spanish | 45.5 /100 | #176 | Average $60,795 |
| Alaska Natives | 44.3 /100 | #177 | Average $60,748 |
| Yup'ik | 43.7 /100 | #178 | Average $60,727 |
| Welsh | 42.2 /100 | #179 | Average $60,666 |
| Immigrants | Morocco | 41.7 /100 | #180 | Average $60,647 |