Mexican vs Slovene Householder Income Over 65 years
COMPARE
Mexican
Slovene
Householder Income Over 65 years
Householder Income Over 65 years Comparison
Mexicans
Slovenes
$53,897
HOUSEHOLDER INCOME OVER 65 YEARS
0.1/ 100
METRIC RATING
285th/ 347
METRIC RANK
$60,241
HOUSEHOLDER INCOME OVER 65 YEARS
31.8/ 100
METRIC RATING
186th/ 347
METRIC RANK
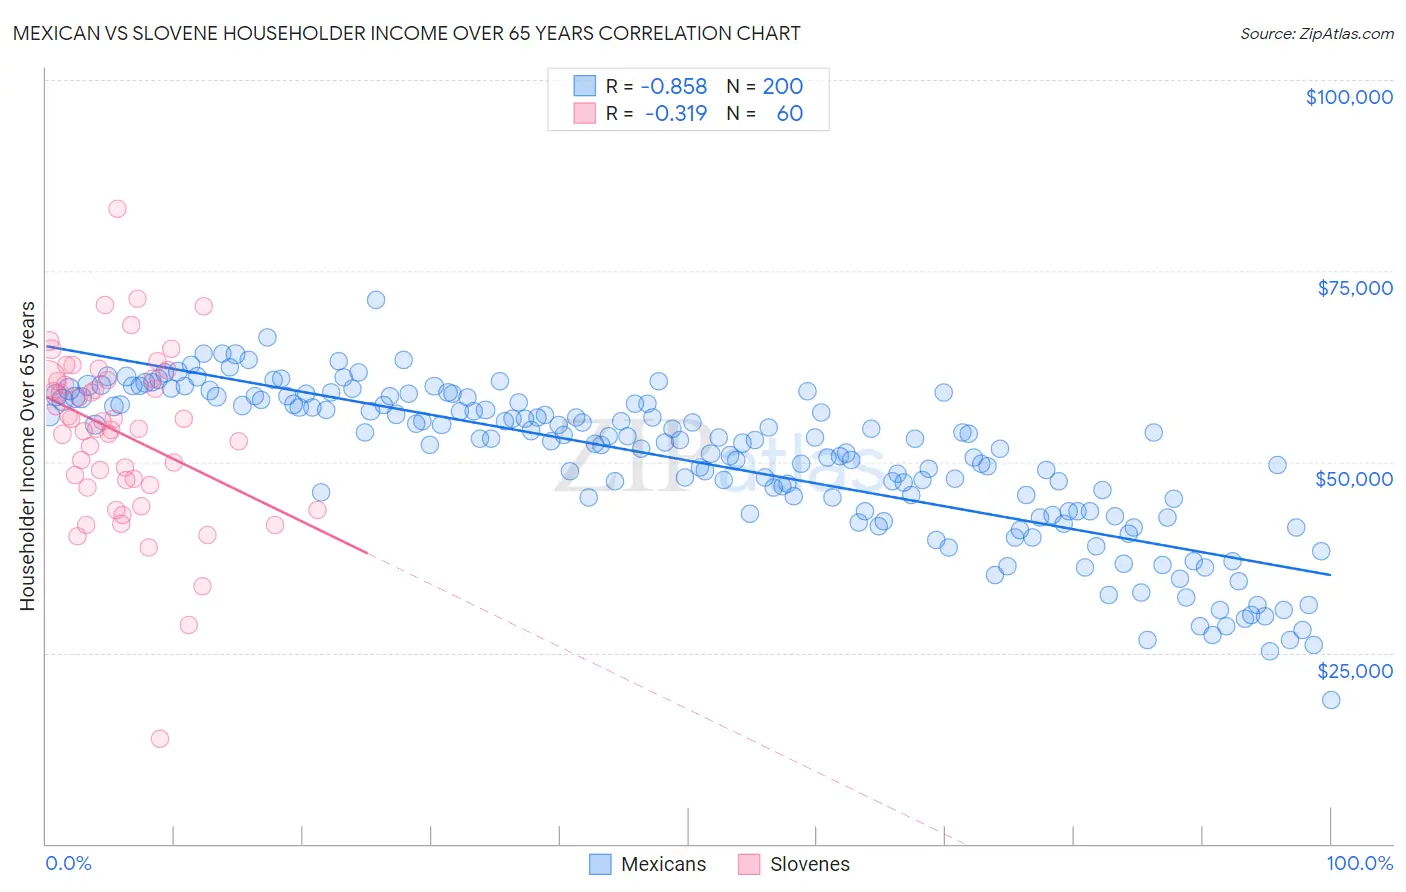
Mexican vs Slovene Householder Income Over 65 years Correlation Chart
The statistical analysis conducted on geographies consisting of 559,960,320 people shows a very strong negative correlation between the proportion of Mexicans and household income with householder over the age of 65 in the United States with a correlation coefficient (R) of -0.858 and weighted average of $53,897. Similarly, the statistical analysis conducted on geographies consisting of 260,915,590 people shows a mild negative correlation between the proportion of Slovenes and household income with householder over the age of 65 in the United States with a correlation coefficient (R) of -0.319 and weighted average of $60,241, a difference of 11.8%.
Householder Income Over 65 years Correlation Summary
| Measurement | Mexican | Slovene |
| Minimum | $18,818 | $13,750 |
| Maximum | $71,178 | $83,108 |
| Range | $52,360 | $69,358 |
| Mean | $50,150 | $53,745 |
| Median | $52,997 | $54,879 |
| Interquartile 25% (IQ1) | $43,543 | $47,317 |
| Interquartile 75% (IQ3) | $58,155 | $60,731 |
| Interquartile Range (IQR) | $14,612 | $13,414 |
| Standard Deviation (Sample) | $10,117 | $11,247 |
| Standard Deviation (Population) | $10,091 | $11,153 |
Similar Demographics by Householder Income Over 65 years
Demographics Similar to Mexicans by Householder Income Over 65 years
In terms of householder income over 65 years, the demographic groups most similar to Mexicans are Chippewa ($53,847, a difference of 0.090%), Immigrants from Guatemala ($53,950, a difference of 0.10%), Immigrants from Liberia ($53,967, a difference of 0.13%), Immigrants from Armenia ($53,974, a difference of 0.14%), and Somali ($54,004, a difference of 0.20%).
| Demographics | Rating | Rank | Householder Income Over 65 years |
| Immigrants | Ecuador | 0.1 /100 | #278 | Tragic $54,030 |
| Blackfeet | 0.1 /100 | #279 | Tragic $54,029 |
| Immigrants | Jamaica | 0.1 /100 | #280 | Tragic $54,027 |
| Somalis | 0.1 /100 | #281 | Tragic $54,004 |
| Immigrants | Armenia | 0.1 /100 | #282 | Tragic $53,974 |
| Immigrants | Liberia | 0.1 /100 | #283 | Tragic $53,967 |
| Immigrants | Guatemala | 0.1 /100 | #284 | Tragic $53,950 |
| Mexicans | 0.1 /100 | #285 | Tragic $53,897 |
| Chippewa | 0.1 /100 | #286 | Tragic $53,847 |
| Immigrants | Barbados | 0.1 /100 | #287 | Tragic $53,766 |
| Paiute | 0.1 /100 | #288 | Tragic $53,762 |
| Iroquois | 0.1 /100 | #289 | Tragic $53,737 |
| Chickasaw | 0.1 /100 | #290 | Tragic $53,732 |
| Africans | 0.0 /100 | #291 | Tragic $53,711 |
| Shoshone | 0.0 /100 | #292 | Tragic $53,681 |
Demographics Similar to Slovenes by Householder Income Over 65 years
In terms of householder income over 65 years, the demographic groups most similar to Slovenes are Albanian ($60,249, a difference of 0.010%), Immigrants from Thailand ($60,217, a difference of 0.040%), Immigrants from Eritrea ($60,096, a difference of 0.24%), Ghanaian ($60,043, a difference of 0.33%), and Iraqi ($60,466, a difference of 0.37%).
| Demographics | Rating | Rank | Householder Income Over 65 years |
| Welsh | 42.2 /100 | #179 | Average $60,666 |
| Immigrants | Morocco | 41.7 /100 | #180 | Average $60,647 |
| Celtics | 40.7 /100 | #181 | Average $60,608 |
| Czechoslovakians | 40.0 /100 | #182 | Average $60,581 |
| Kenyans | 38.4 /100 | #183 | Fair $60,514 |
| Iraqis | 37.2 /100 | #184 | Fair $60,466 |
| Albanians | 32.0 /100 | #185 | Fair $60,249 |
| Slovenes | 31.8 /100 | #186 | Fair $60,241 |
| Immigrants | Thailand | 31.3 /100 | #187 | Fair $60,217 |
| Immigrants | Eritrea | 28.6 /100 | #188 | Fair $60,096 |
| Ghanaians | 27.5 /100 | #189 | Fair $60,043 |
| Puget Sound Salish | 25.3 /100 | #190 | Fair $59,934 |
| Belgians | 24.9 /100 | #191 | Fair $59,915 |
| South Americans | 23.8 /100 | #192 | Fair $59,854 |
| Immigrants | Costa Rica | 23.6 /100 | #193 | Fair $59,848 |