Immigrants from Israel vs Immigrants from Italy Householder Income Ages 25 - 44 years
COMPARE
Immigrants from Israel
Immigrants from Italy
Householder Income Ages 25 - 44 years
Householder Income Ages 25 - 44 years Comparison
Immigrants from Israel
Immigrants from Italy
$117,219
HOUSEHOLDER INCOME AGES 25 - 44 YEARS
100.0/ 100
METRIC RATING
14th/ 347
METRIC RANK
$105,201
HOUSEHOLDER INCOME AGES 25 - 44 YEARS
99.7/ 100
METRIC RATING
62nd/ 347
METRIC RANK
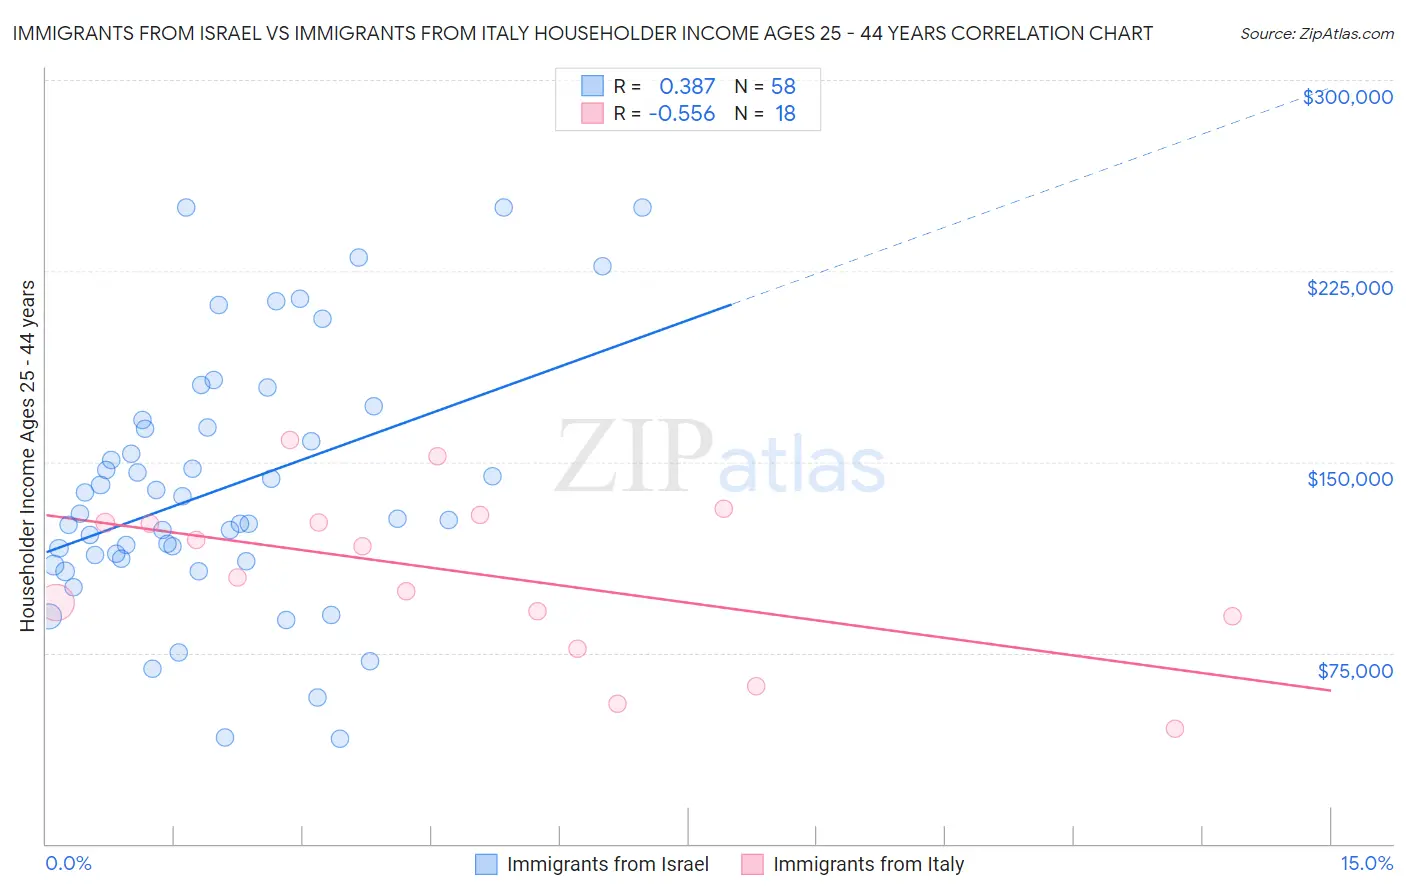
Immigrants from Israel vs Immigrants from Italy Householder Income Ages 25 - 44 years Correlation Chart
The statistical analysis conducted on geographies consisting of 209,652,410 people shows a mild positive correlation between the proportion of Immigrants from Israel and household income with householder between the ages 25 and 44 in the United States with a correlation coefficient (R) of 0.387 and weighted average of $117,219. Similarly, the statistical analysis conducted on geographies consisting of 323,420,404 people shows a substantial negative correlation between the proportion of Immigrants from Italy and household income with householder between the ages 25 and 44 in the United States with a correlation coefficient (R) of -0.556 and weighted average of $105,201, a difference of 11.4%.
Householder Income Ages 25 - 44 years Correlation Summary
| Measurement | Immigrants from Israel | Immigrants from Italy |
| Minimum | $41,167 | $45,256 |
| Maximum | $250,001 | $158,531 |
| Range | $208,834 | $113,275 |
| Mean | $139,627 | $105,762 |
| Median | $128,756 | $110,729 |
| Interquartile 25% (IQ1) | $112,036 | $89,375 |
| Interquartile 75% (IQ3) | $163,605 | $126,307 |
| Interquartile Range (IQR) | $51,569 | $36,932 |
| Standard Deviation (Sample) | $49,677 | $31,956 |
| Standard Deviation (Population) | $49,247 | $31,055 |
Similar Demographics by Householder Income Ages 25 - 44 years
Demographics Similar to Immigrants from Israel by Householder Income Ages 25 - 44 years
In terms of householder income ages 25 - 44 years, the demographic groups most similar to Immigrants from Israel are Immigrants from South Central Asia ($116,626, a difference of 0.51%), Immigrants from Eastern Asia ($118,056, a difference of 0.71%), Cypriot ($116,364, a difference of 0.73%), Immigrants from Australia ($115,947, a difference of 1.1%), and Immigrants from Iran ($119,204, a difference of 1.7%).
| Demographics | Rating | Rank | Householder Income Ages 25 - 44 years |
| Immigrants | Ireland | 100.0 /100 | #7 | Exceptional $120,333 |
| Iranians | 100.0 /100 | #8 | Exceptional $120,292 |
| Immigrants | China | 100.0 /100 | #9 | Exceptional $119,756 |
| Indians (Asian) | 100.0 /100 | #10 | Exceptional $119,496 |
| Okinawans | 100.0 /100 | #11 | Exceptional $119,349 |
| Immigrants | Iran | 100.0 /100 | #12 | Exceptional $119,204 |
| Immigrants | Eastern Asia | 100.0 /100 | #13 | Exceptional $118,056 |
| Immigrants | Israel | 100.0 /100 | #14 | Exceptional $117,219 |
| Immigrants | South Central Asia | 100.0 /100 | #15 | Exceptional $116,626 |
| Cypriots | 100.0 /100 | #16 | Exceptional $116,364 |
| Immigrants | Australia | 100.0 /100 | #17 | Exceptional $115,947 |
| Eastern Europeans | 100.0 /100 | #18 | Exceptional $114,523 |
| Burmese | 100.0 /100 | #19 | Exceptional $113,701 |
| Immigrants | Korea | 100.0 /100 | #20 | Exceptional $113,401 |
| Asians | 100.0 /100 | #21 | Exceptional $112,666 |
Demographics Similar to Immigrants from Italy by Householder Income Ages 25 - 44 years
In terms of householder income ages 25 - 44 years, the demographic groups most similar to Immigrants from Italy are Lithuanian ($105,223, a difference of 0.020%), Egyptian ($105,282, a difference of 0.080%), Immigrants from Scotland ($105,089, a difference of 0.11%), New Zealander ($105,085, a difference of 0.11%), and Immigrants from Netherlands ($105,082, a difference of 0.11%).
| Demographics | Rating | Rank | Householder Income Ages 25 - 44 years |
| Greeks | 99.9 /100 | #55 | Exceptional $106,457 |
| Immigrants | Pakistan | 99.8 /100 | #56 | Exceptional $106,129 |
| Immigrants | Austria | 99.8 /100 | #57 | Exceptional $106,103 |
| Immigrants | South Africa | 99.8 /100 | #58 | Exceptional $105,748 |
| Immigrants | Latvia | 99.8 /100 | #59 | Exceptional $105,522 |
| Egyptians | 99.7 /100 | #60 | Exceptional $105,282 |
| Lithuanians | 99.7 /100 | #61 | Exceptional $105,223 |
| Immigrants | Italy | 99.7 /100 | #62 | Exceptional $105,201 |
| Immigrants | Scotland | 99.7 /100 | #63 | Exceptional $105,089 |
| New Zealanders | 99.7 /100 | #64 | Exceptional $105,085 |
| Immigrants | Netherlands | 99.7 /100 | #65 | Exceptional $105,082 |
| Laotians | 99.7 /100 | #66 | Exceptional $104,993 |
| Immigrants | Romania | 99.6 /100 | #67 | Exceptional $104,713 |
| Immigrants | Eastern Europe | 99.6 /100 | #68 | Exceptional $104,662 |
| Mongolians | 99.6 /100 | #69 | Exceptional $104,578 |