Mexican American Indian vs Immigrants from Italy Median Male Earnings
COMPARE
Mexican American Indian
Immigrants from Italy
Median Male Earnings
Median Male Earnings Comparison
Mexican American Indians
Immigrants from Italy
$47,990
MEDIAN MALE EARNINGS
0.2/ 100
METRIC RATING
286th/ 347
METRIC RANK
$59,691
MEDIAN MALE EARNINGS
99.4/ 100
METRIC RATING
83rd/ 347
METRIC RANK
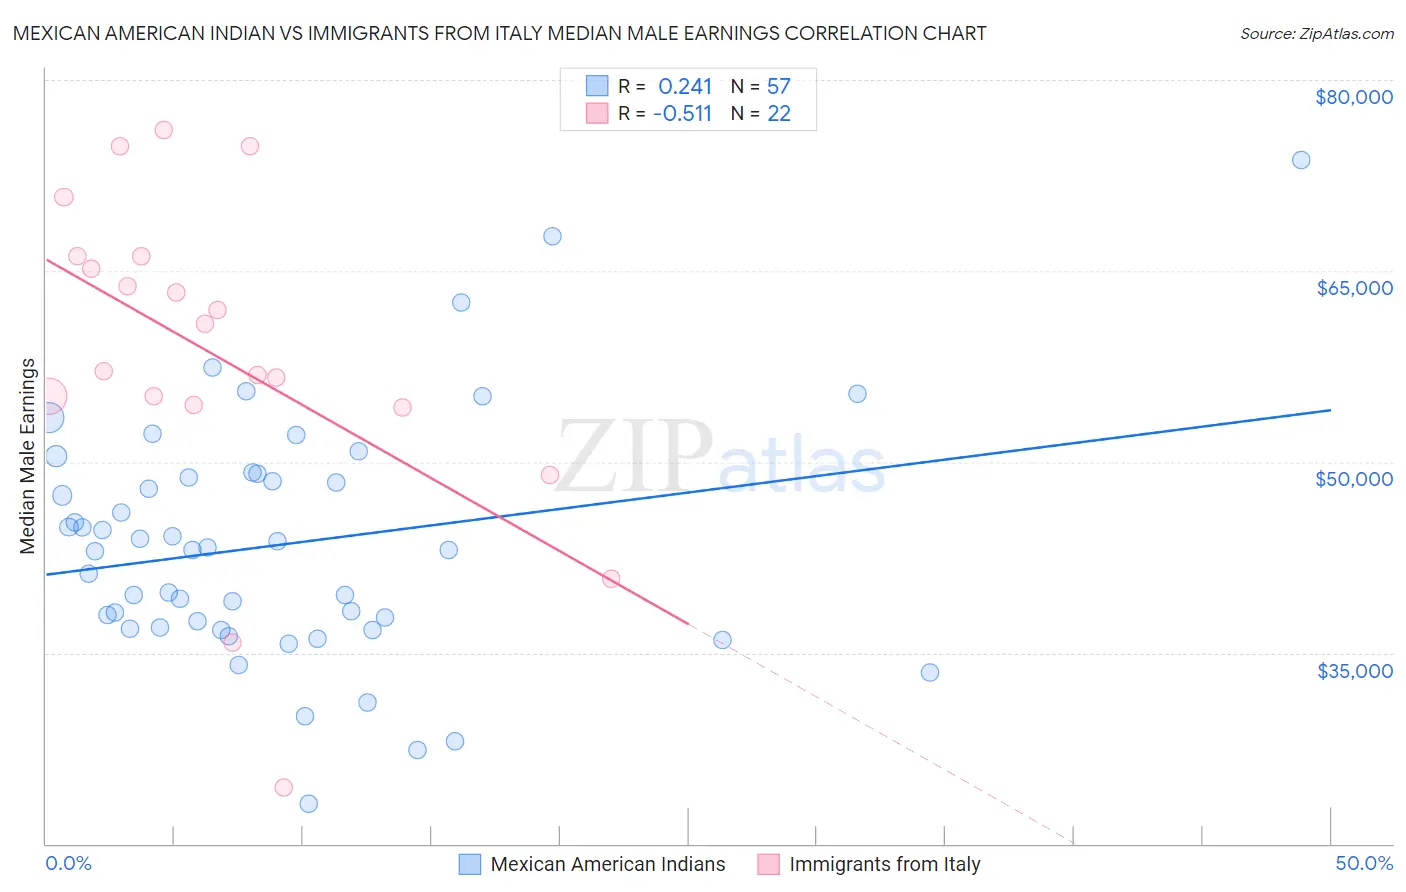
Mexican American Indian vs Immigrants from Italy Median Male Earnings Correlation Chart
The statistical analysis conducted on geographies consisting of 317,531,084 people shows a weak positive correlation between the proportion of Mexican American Indians and median male earnings in the United States with a correlation coefficient (R) of 0.241 and weighted average of $47,990. Similarly, the statistical analysis conducted on geographies consisting of 324,142,544 people shows a substantial negative correlation between the proportion of Immigrants from Italy and median male earnings in the United States with a correlation coefficient (R) of -0.511 and weighted average of $59,691, a difference of 24.4%.
Median Male Earnings Correlation Summary
| Measurement | Mexican American Indian | Immigrants from Italy |
| Minimum | $23,167 | $24,375 |
| Maximum | $73,750 | $76,045 |
| Range | $50,583 | $51,670 |
| Mean | $43,547 | $58,332 |
| Median | $43,107 | $58,952 |
| Interquartile 25% (IQ1) | $36,938 | $54,435 |
| Interquartile 75% (IQ3) | $48,895 | $66,141 |
| Interquartile Range (IQR) | $11,957 | $11,706 |
| Standard Deviation (Sample) | $9,541 | $12,664 |
| Standard Deviation (Population) | $9,457 | $12,373 |
Similar Demographics by Median Male Earnings
Demographics Similar to Mexican American Indians by Median Male Earnings
In terms of median male earnings, the demographic groups most similar to Mexican American Indians are Paiute ($47,991, a difference of 0.0%), African ($47,994, a difference of 0.010%), Immigrants from El Salvador ($47,973, a difference of 0.040%), Immigrants from Jamaica ($48,040, a difference of 0.10%), and Shoshone ($47,930, a difference of 0.12%).
| Demographics | Rating | Rank | Median Male Earnings |
| Hmong | 0.2 /100 | #279 | Tragic $48,254 |
| Comanche | 0.2 /100 | #280 | Tragic $48,202 |
| Marshallese | 0.2 /100 | #281 | Tragic $48,137 |
| Central Americans | 0.2 /100 | #282 | Tragic $48,093 |
| Immigrants | Jamaica | 0.2 /100 | #283 | Tragic $48,040 |
| Africans | 0.2 /100 | #284 | Tragic $47,994 |
| Paiute | 0.2 /100 | #285 | Tragic $47,991 |
| Mexican American Indians | 0.2 /100 | #286 | Tragic $47,990 |
| Immigrants | El Salvador | 0.2 /100 | #287 | Tragic $47,973 |
| Shoshone | 0.2 /100 | #288 | Tragic $47,930 |
| Chickasaw | 0.1 /100 | #289 | Tragic $47,832 |
| Immigrants | Belize | 0.1 /100 | #290 | Tragic $47,809 |
| Choctaw | 0.1 /100 | #291 | Tragic $47,729 |
| Immigrants | Dominica | 0.1 /100 | #292 | Tragic $47,651 |
| Indonesians | 0.1 /100 | #293 | Tragic $47,503 |
Demographics Similar to Immigrants from Italy by Median Male Earnings
In terms of median male earnings, the demographic groups most similar to Immigrants from Italy are Croatian ($59,715, a difference of 0.040%), Ukrainian ($59,728, a difference of 0.060%), Immigrants from Hungary ($59,806, a difference of 0.19%), Immigrants from Ukraine ($59,820, a difference of 0.22%), and Afghan ($59,554, a difference of 0.23%).
| Demographics | Rating | Rank | Median Male Earnings |
| Romanians | 99.6 /100 | #76 | Exceptional $60,063 |
| Paraguayans | 99.5 /100 | #77 | Exceptional $59,975 |
| Immigrants | Egypt | 99.5 /100 | #78 | Exceptional $59,925 |
| Immigrants | Ukraine | 99.5 /100 | #79 | Exceptional $59,820 |
| Immigrants | Hungary | 99.5 /100 | #80 | Exceptional $59,806 |
| Ukrainians | 99.4 /100 | #81 | Exceptional $59,728 |
| Croatians | 99.4 /100 | #82 | Exceptional $59,715 |
| Immigrants | Italy | 99.4 /100 | #83 | Exceptional $59,691 |
| Afghans | 99.3 /100 | #84 | Exceptional $59,554 |
| Italians | 99.3 /100 | #85 | Exceptional $59,551 |
| Immigrants | England | 99.3 /100 | #86 | Exceptional $59,527 |
| Macedonians | 99.3 /100 | #87 | Exceptional $59,522 |
| Immigrants | Argentina | 99.3 /100 | #88 | Exceptional $59,491 |
| Immigrants | Moldova | 99.2 /100 | #89 | Exceptional $59,417 |
| Austrians | 99.2 /100 | #90 | Exceptional $59,359 |