Sioux vs Immigrants from Italy Householder Income Ages 25 - 44 years
COMPARE
Sioux
Immigrants from Italy
Householder Income Ages 25 - 44 years
Householder Income Ages 25 - 44 years Comparison
Sioux
Immigrants from Italy
$77,089
HOUSEHOLDER INCOME AGES 25 - 44 YEARS
0.0/ 100
METRIC RATING
325th/ 347
METRIC RANK
$105,201
HOUSEHOLDER INCOME AGES 25 - 44 YEARS
99.7/ 100
METRIC RATING
62nd/ 347
METRIC RANK
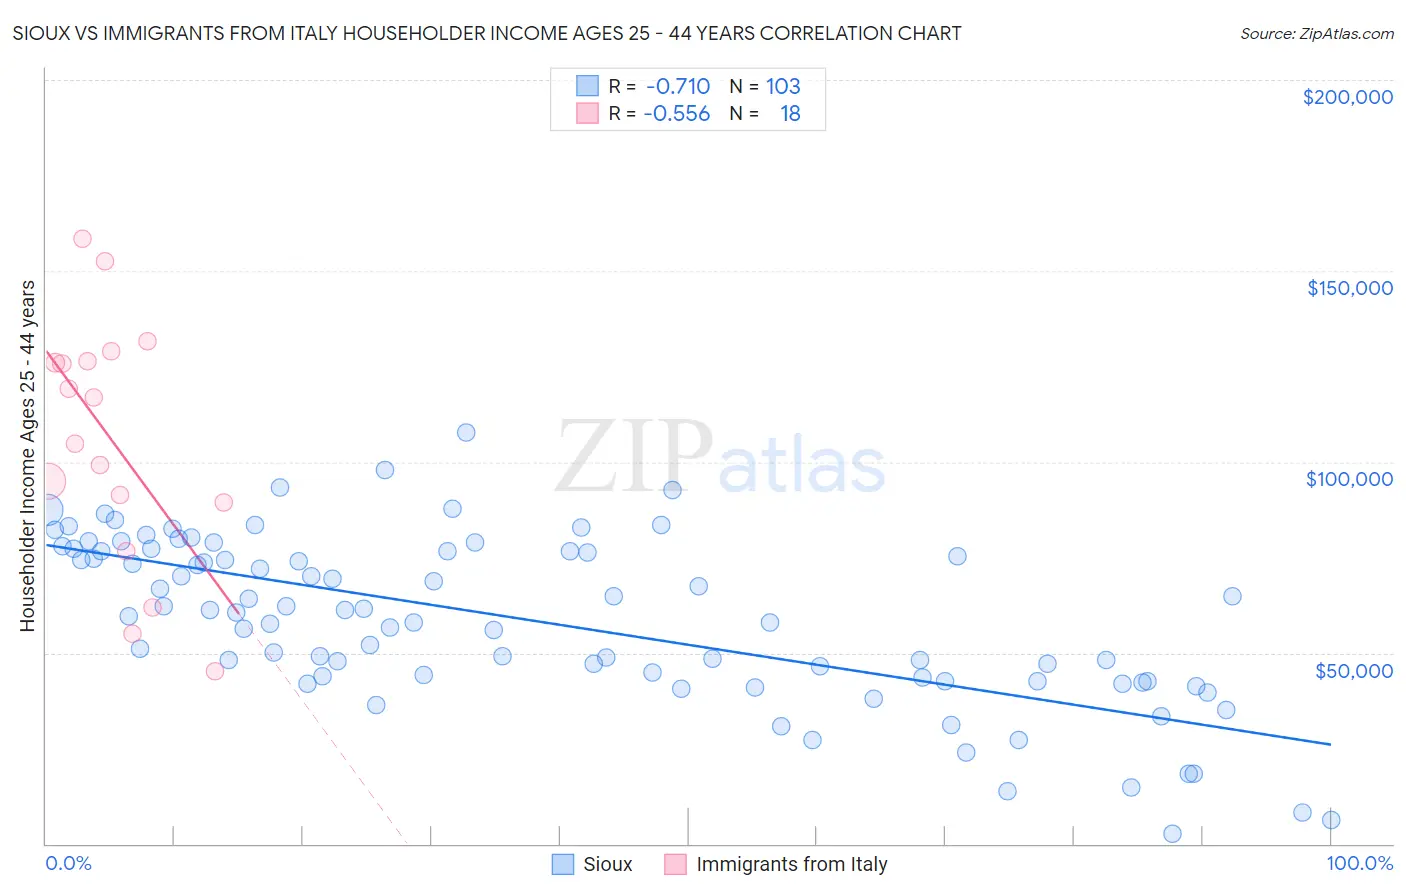
Sioux vs Immigrants from Italy Householder Income Ages 25 - 44 years Correlation Chart
The statistical analysis conducted on geographies consisting of 233,739,759 people shows a strong negative correlation between the proportion of Sioux and household income with householder between the ages 25 and 44 in the United States with a correlation coefficient (R) of -0.710 and weighted average of $77,089. Similarly, the statistical analysis conducted on geographies consisting of 323,420,404 people shows a substantial negative correlation between the proportion of Immigrants from Italy and household income with householder between the ages 25 and 44 in the United States with a correlation coefficient (R) of -0.556 and weighted average of $105,201, a difference of 36.5%.
Householder Income Ages 25 - 44 years Correlation Summary
| Measurement | Sioux | Immigrants from Italy |
| Minimum | $2,499 | $45,256 |
| Maximum | $107,750 | $158,531 |
| Range | $105,251 | $113,275 |
| Mean | $58,364 | $105,762 |
| Median | $60,620 | $110,729 |
| Interquartile 25% (IQ1) | $42,554 | $89,375 |
| Interquartile 75% (IQ3) | $76,563 | $126,307 |
| Interquartile Range (IQR) | $34,009 | $36,932 |
| Standard Deviation (Sample) | $21,906 | $31,956 |
| Standard Deviation (Population) | $21,799 | $31,055 |
Similar Demographics by Householder Income Ages 25 - 44 years
Demographics Similar to Sioux by Householder Income Ages 25 - 44 years
In terms of householder income ages 25 - 44 years, the demographic groups most similar to Sioux are Houma ($77,044, a difference of 0.060%), Dutch West Indian ($77,260, a difference of 0.22%), Immigrants from Bahamas ($76,910, a difference of 0.23%), Immigrants from Honduras ($77,328, a difference of 0.31%), and Immigrants from Cuba ($76,701, a difference of 0.51%).
| Demographics | Rating | Rank | Householder Income Ages 25 - 44 years |
| Immigrants | Mexico | 0.0 /100 | #318 | Tragic $78,809 |
| Hondurans | 0.0 /100 | #319 | Tragic $78,540 |
| Choctaw | 0.0 /100 | #320 | Tragic $78,168 |
| Immigrants | Zaire | 0.0 /100 | #321 | Tragic $78,045 |
| Chickasaw | 0.0 /100 | #322 | Tragic $77,929 |
| Immigrants | Honduras | 0.0 /100 | #323 | Tragic $77,328 |
| Dutch West Indians | 0.0 /100 | #324 | Tragic $77,260 |
| Sioux | 0.0 /100 | #325 | Tragic $77,089 |
| Houma | 0.0 /100 | #326 | Tragic $77,044 |
| Immigrants | Bahamas | 0.0 /100 | #327 | Tragic $76,910 |
| Immigrants | Cuba | 0.0 /100 | #328 | Tragic $76,701 |
| Seminole | 0.0 /100 | #329 | Tragic $76,584 |
| Yakama | 0.0 /100 | #330 | Tragic $76,226 |
| Natives/Alaskans | 0.0 /100 | #331 | Tragic $75,647 |
| Bahamians | 0.0 /100 | #332 | Tragic $75,395 |
Demographics Similar to Immigrants from Italy by Householder Income Ages 25 - 44 years
In terms of householder income ages 25 - 44 years, the demographic groups most similar to Immigrants from Italy are Lithuanian ($105,223, a difference of 0.020%), Egyptian ($105,282, a difference of 0.080%), Immigrants from Scotland ($105,089, a difference of 0.11%), New Zealander ($105,085, a difference of 0.11%), and Immigrants from Netherlands ($105,082, a difference of 0.11%).
| Demographics | Rating | Rank | Householder Income Ages 25 - 44 years |
| Greeks | 99.9 /100 | #55 | Exceptional $106,457 |
| Immigrants | Pakistan | 99.8 /100 | #56 | Exceptional $106,129 |
| Immigrants | Austria | 99.8 /100 | #57 | Exceptional $106,103 |
| Immigrants | South Africa | 99.8 /100 | #58 | Exceptional $105,748 |
| Immigrants | Latvia | 99.8 /100 | #59 | Exceptional $105,522 |
| Egyptians | 99.7 /100 | #60 | Exceptional $105,282 |
| Lithuanians | 99.7 /100 | #61 | Exceptional $105,223 |
| Immigrants | Italy | 99.7 /100 | #62 | Exceptional $105,201 |
| Immigrants | Scotland | 99.7 /100 | #63 | Exceptional $105,089 |
| New Zealanders | 99.7 /100 | #64 | Exceptional $105,085 |
| Immigrants | Netherlands | 99.7 /100 | #65 | Exceptional $105,082 |
| Laotians | 99.7 /100 | #66 | Exceptional $104,993 |
| Immigrants | Romania | 99.6 /100 | #67 | Exceptional $104,713 |
| Immigrants | Eastern Europe | 99.6 /100 | #68 | Exceptional $104,662 |
| Mongolians | 99.6 /100 | #69 | Exceptional $104,578 |