Bangladeshi vs Immigrants from Italy Householder Income Ages 25 - 44 years
COMPARE
Bangladeshi
Immigrants from Italy
Householder Income Ages 25 - 44 years
Householder Income Ages 25 - 44 years Comparison
Bangladeshis
Immigrants from Italy
$81,363
HOUSEHOLDER INCOME AGES 25 - 44 YEARS
0.1/ 100
METRIC RATING
295th/ 347
METRIC RANK
$105,201
HOUSEHOLDER INCOME AGES 25 - 44 YEARS
99.7/ 100
METRIC RATING
62nd/ 347
METRIC RANK
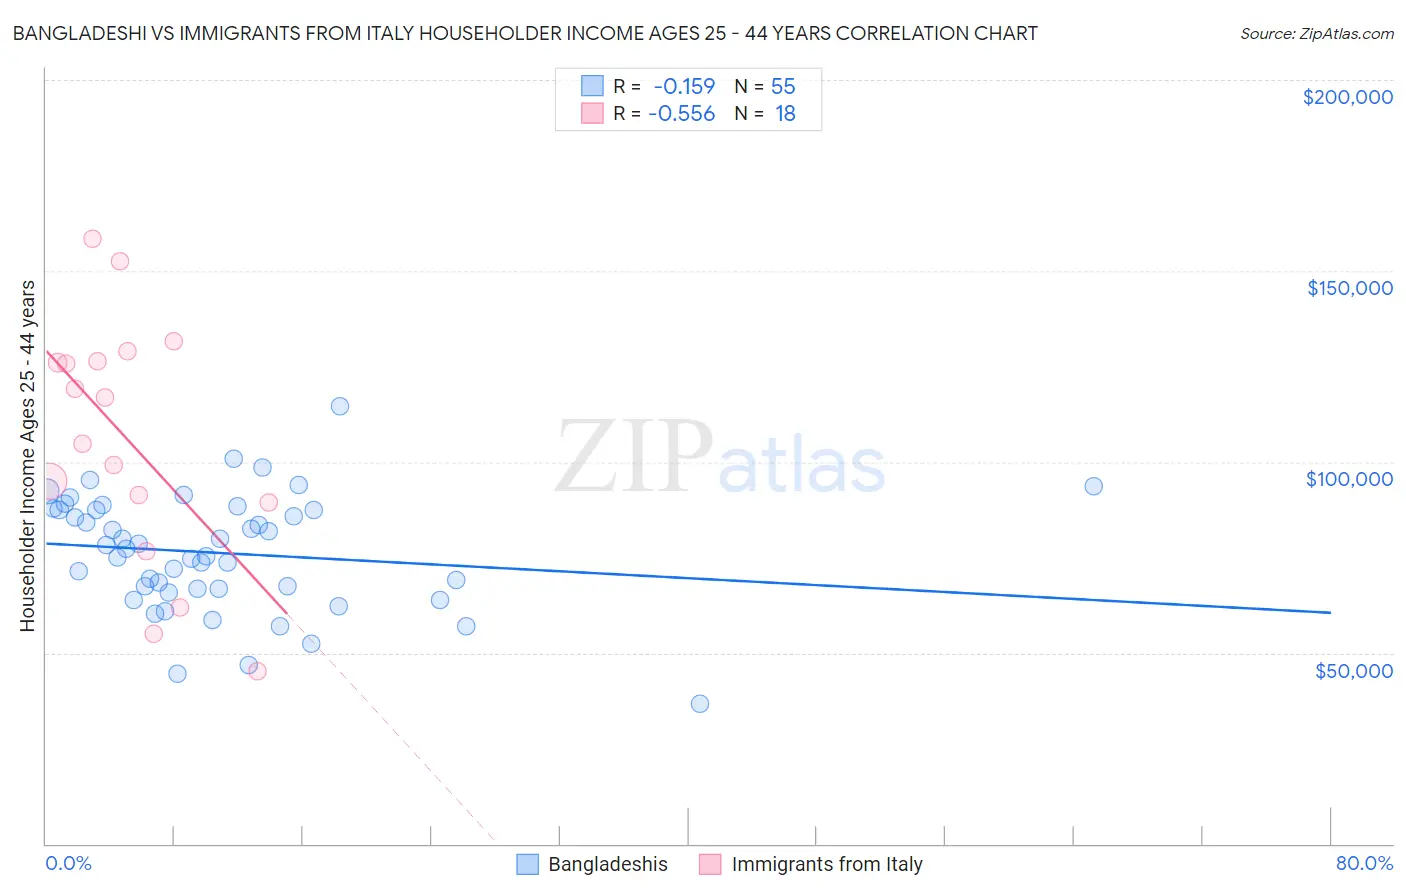
Bangladeshi vs Immigrants from Italy Householder Income Ages 25 - 44 years Correlation Chart
The statistical analysis conducted on geographies consisting of 141,274,107 people shows a poor negative correlation between the proportion of Bangladeshis and household income with householder between the ages 25 and 44 in the United States with a correlation coefficient (R) of -0.159 and weighted average of $81,363. Similarly, the statistical analysis conducted on geographies consisting of 323,420,404 people shows a substantial negative correlation between the proportion of Immigrants from Italy and household income with householder between the ages 25 and 44 in the United States with a correlation coefficient (R) of -0.556 and weighted average of $105,201, a difference of 29.3%.
Householder Income Ages 25 - 44 years Correlation Summary
| Measurement | Bangladeshi | Immigrants from Italy |
| Minimum | $36,818 | $45,256 |
| Maximum | $114,417 | $158,531 |
| Range | $77,599 | $113,275 |
| Mean | $76,117 | $105,762 |
| Median | $77,308 | $110,729 |
| Interquartile 25% (IQ1) | $66,732 | $89,375 |
| Interquartile 75% (IQ3) | $87,531 | $126,307 |
| Interquartile Range (IQR) | $20,799 | $36,932 |
| Standard Deviation (Sample) | $15,116 | $31,956 |
| Standard Deviation (Population) | $14,978 | $31,055 |
Similar Demographics by Householder Income Ages 25 - 44 years
Demographics Similar to Bangladeshis by Householder Income Ages 25 - 44 years
In terms of householder income ages 25 - 44 years, the demographic groups most similar to Bangladeshis are Immigrants from Dominica ($81,351, a difference of 0.020%), Immigrants from Guatemala ($81,341, a difference of 0.030%), Cuban ($81,483, a difference of 0.15%), Dominican ($81,229, a difference of 0.17%), and Blackfeet ($81,531, a difference of 0.21%).
| Demographics | Rating | Rank | Householder Income Ages 25 - 44 years |
| Comanche | 0.1 /100 | #288 | Tragic $82,152 |
| Shoshone | 0.1 /100 | #289 | Tragic $82,062 |
| Liberians | 0.1 /100 | #290 | Tragic $82,005 |
| Potawatomi | 0.1 /100 | #291 | Tragic $81,774 |
| Yaqui | 0.1 /100 | #292 | Tragic $81,656 |
| Blackfeet | 0.1 /100 | #293 | Tragic $81,531 |
| Cubans | 0.1 /100 | #294 | Tragic $81,483 |
| Bangladeshis | 0.1 /100 | #295 | Tragic $81,363 |
| Immigrants | Dominica | 0.1 /100 | #296 | Tragic $81,351 |
| Immigrants | Guatemala | 0.1 /100 | #297 | Tragic $81,341 |
| Dominicans | 0.1 /100 | #298 | Tragic $81,229 |
| Immigrants | Liberia | 0.1 /100 | #299 | Tragic $80,863 |
| Cherokee | 0.0 /100 | #300 | Tragic $80,843 |
| Immigrants | Micronesia | 0.0 /100 | #301 | Tragic $80,544 |
| Hispanics or Latinos | 0.0 /100 | #302 | Tragic $80,515 |
Demographics Similar to Immigrants from Italy by Householder Income Ages 25 - 44 years
In terms of householder income ages 25 - 44 years, the demographic groups most similar to Immigrants from Italy are Lithuanian ($105,223, a difference of 0.020%), Egyptian ($105,282, a difference of 0.080%), Immigrants from Scotland ($105,089, a difference of 0.11%), New Zealander ($105,085, a difference of 0.11%), and Immigrants from Netherlands ($105,082, a difference of 0.11%).
| Demographics | Rating | Rank | Householder Income Ages 25 - 44 years |
| Greeks | 99.9 /100 | #55 | Exceptional $106,457 |
| Immigrants | Pakistan | 99.8 /100 | #56 | Exceptional $106,129 |
| Immigrants | Austria | 99.8 /100 | #57 | Exceptional $106,103 |
| Immigrants | South Africa | 99.8 /100 | #58 | Exceptional $105,748 |
| Immigrants | Latvia | 99.8 /100 | #59 | Exceptional $105,522 |
| Egyptians | 99.7 /100 | #60 | Exceptional $105,282 |
| Lithuanians | 99.7 /100 | #61 | Exceptional $105,223 |
| Immigrants | Italy | 99.7 /100 | #62 | Exceptional $105,201 |
| Immigrants | Scotland | 99.7 /100 | #63 | Exceptional $105,089 |
| New Zealanders | 99.7 /100 | #64 | Exceptional $105,085 |
| Immigrants | Netherlands | 99.7 /100 | #65 | Exceptional $105,082 |
| Laotians | 99.7 /100 | #66 | Exceptional $104,993 |
| Immigrants | Romania | 99.6 /100 | #67 | Exceptional $104,713 |
| Immigrants | Eastern Europe | 99.6 /100 | #68 | Exceptional $104,662 |
| Mongolians | 99.6 /100 | #69 | Exceptional $104,578 |