Menominee vs Immigrants from Grenada Median Male Earnings
COMPARE
Menominee
Immigrants from Grenada
Median Male Earnings
Median Male Earnings Comparison
Menominee
Immigrants from Grenada
$42,581
MEDIAN MALE EARNINGS
0.0/ 100
METRIC RATING
337th/ 347
METRIC RANK
$50,279
MEDIAN MALE EARNINGS
1.6/ 100
METRIC RATING
251st/ 347
METRIC RANK
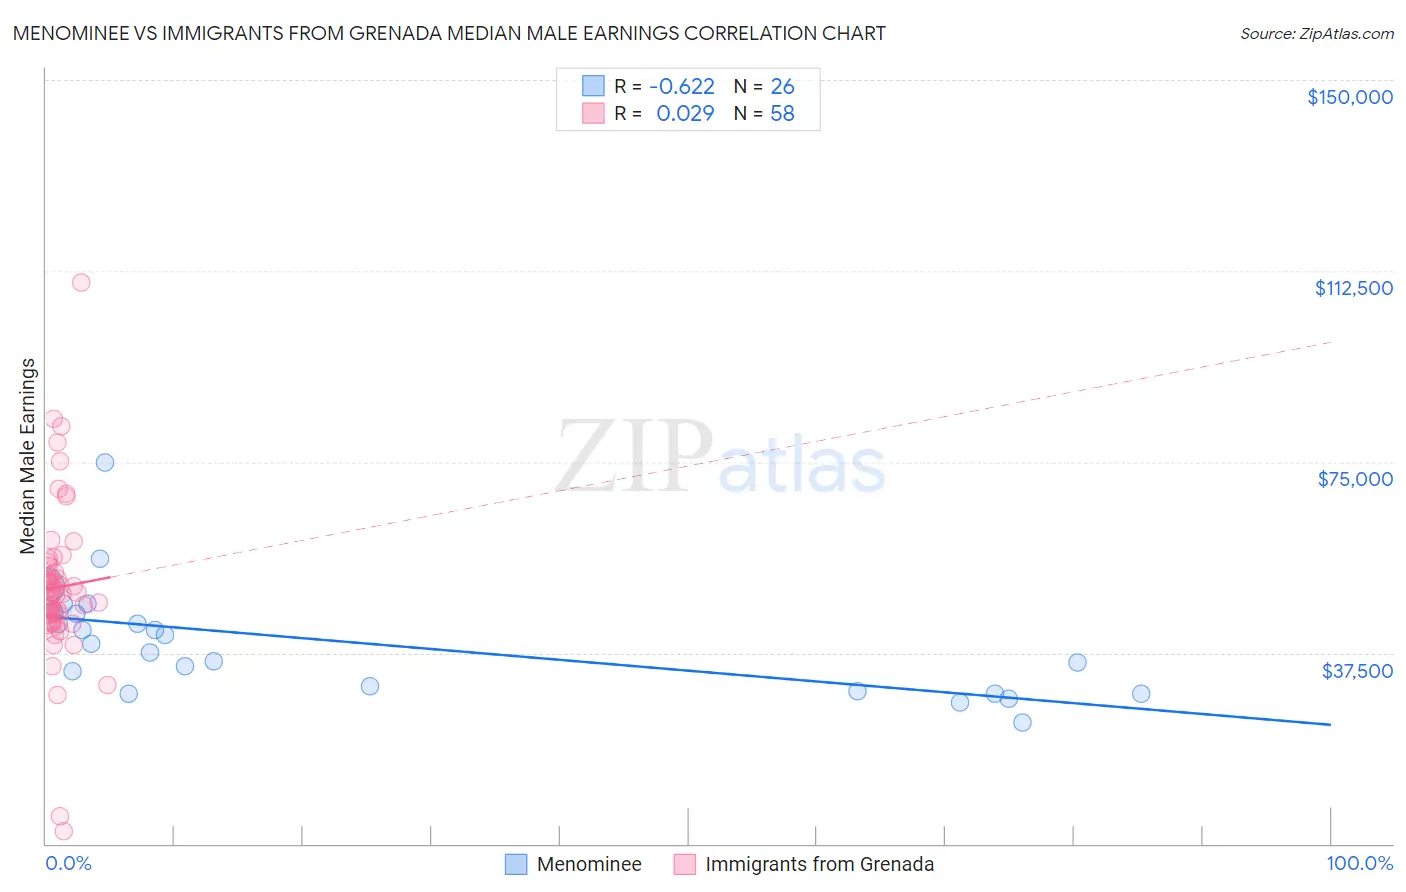
Menominee vs Immigrants from Grenada Median Male Earnings Correlation Chart
The statistical analysis conducted on geographies consisting of 45,775,457 people shows a significant negative correlation between the proportion of Menominee and median male earnings in the United States with a correlation coefficient (R) of -0.622 and weighted average of $42,581. Similarly, the statistical analysis conducted on geographies consisting of 67,198,306 people shows no correlation between the proportion of Immigrants from Grenada and median male earnings in the United States with a correlation coefficient (R) of 0.029 and weighted average of $50,279, a difference of 18.1%.
Median Male Earnings Correlation Summary
| Measurement | Menominee | Immigrants from Grenada |
| Minimum | $23,828 | $2,499 |
| Maximum | $75,000 | $110,313 |
| Range | $51,172 | $107,814 |
| Mean | $39,395 | $50,381 |
| Median | $38,495 | $49,246 |
| Interquartile 25% (IQ1) | $29,844 | $43,797 |
| Interquartile 75% (IQ3) | $45,222 | $54,582 |
| Interquartile Range (IQR) | $15,378 | $10,785 |
| Standard Deviation (Sample) | $10,853 | $16,114 |
| Standard Deviation (Population) | $10,643 | $15,975 |
Similar Demographics by Median Male Earnings
Demographics Similar to Menominee by Median Male Earnings
In terms of median male earnings, the demographic groups most similar to Menominee are Crow ($42,434, a difference of 0.35%), Pima ($42,357, a difference of 0.53%), Navajo ($42,098, a difference of 1.1%), Hopi ($42,060, a difference of 1.2%), and Arapaho ($41,758, a difference of 2.0%).
| Demographics | Rating | Rank | Median Male Earnings |
| Immigrants | Mexico | 0.0 /100 | #330 | Tragic $44,960 |
| Natives/Alaskans | 0.0 /100 | #331 | Tragic $44,775 |
| Bahamians | 0.0 /100 | #332 | Tragic $44,756 |
| Immigrants | Congo | 0.0 /100 | #333 | Tragic $44,204 |
| Immigrants | Yemen | 0.0 /100 | #334 | Tragic $44,083 |
| Spanish American Indians | 0.0 /100 | #335 | Tragic $44,010 |
| Immigrants | Cuba | 0.0 /100 | #336 | Tragic $43,461 |
| Menominee | 0.0 /100 | #337 | Tragic $42,581 |
| Crow | 0.0 /100 | #338 | Tragic $42,434 |
| Pima | 0.0 /100 | #339 | Tragic $42,357 |
| Navajo | 0.0 /100 | #340 | Tragic $42,098 |
| Hopi | 0.0 /100 | #341 | Tragic $42,060 |
| Arapaho | 0.0 /100 | #342 | Tragic $41,758 |
| Lumbee | 0.0 /100 | #343 | Tragic $41,715 |
| Pueblo | 0.0 /100 | #344 | Tragic $41,314 |
Demographics Similar to Immigrants from Grenada by Median Male Earnings
In terms of median male earnings, the demographic groups most similar to Immigrants from Grenada are Osage ($50,292, a difference of 0.020%), Immigrants from Burma/Myanmar ($50,298, a difference of 0.040%), Immigrants from Guyana ($50,321, a difference of 0.080%), Subsaharan African ($50,408, a difference of 0.26%), and Immigrants from Ecuador ($50,474, a difference of 0.39%).
| Demographics | Rating | Rank | Median Male Earnings |
| Houma | 2.0 /100 | #244 | Tragic $50,547 |
| Hawaiians | 1.9 /100 | #245 | Tragic $50,488 |
| Immigrants | Ecuador | 1.9 /100 | #246 | Tragic $50,474 |
| Sub-Saharan Africans | 1.8 /100 | #247 | Tragic $50,408 |
| Immigrants | Guyana | 1.6 /100 | #248 | Tragic $50,321 |
| Immigrants | Burma/Myanmar | 1.6 /100 | #249 | Tragic $50,298 |
| Osage | 1.6 /100 | #250 | Tragic $50,292 |
| Immigrants | Grenada | 1.6 /100 | #251 | Tragic $50,279 |
| Immigrants | Cabo Verde | 1.2 /100 | #252 | Tragic $50,009 |
| German Russians | 1.1 /100 | #253 | Tragic $49,924 |
| Senegalese | 1.0 /100 | #254 | Tragic $49,774 |
| Alaskan Athabascans | 0.9 /100 | #255 | Tragic $49,748 |
| Alaska Natives | 0.9 /100 | #256 | Tragic $49,711 |
| British West Indians | 0.8 /100 | #257 | Tragic $49,636 |
| Cree | 0.7 /100 | #258 | Tragic $49,497 |