Menominee vs Immigrants from Zaire Median Male Earnings
COMPARE
Menominee
Immigrants from Zaire
Median Male Earnings
Median Male Earnings Comparison
Menominee
Immigrants from Zaire
$42,581
MEDIAN MALE EARNINGS
0.0/ 100
METRIC RATING
337th/ 347
METRIC RANK
$47,070
MEDIAN MALE EARNINGS
0.1/ 100
METRIC RATING
299th/ 347
METRIC RANK
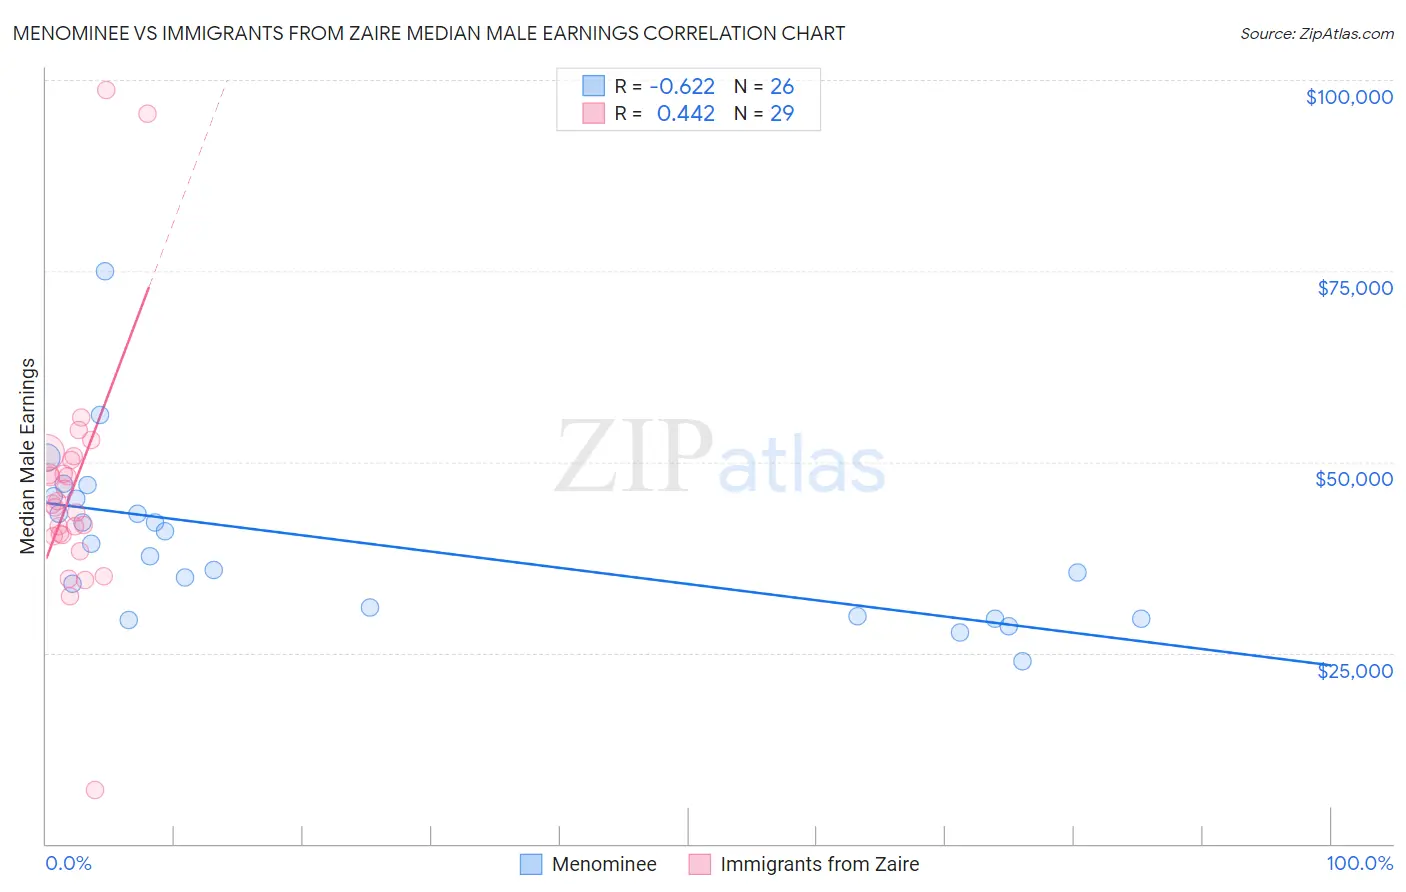
Menominee vs Immigrants from Zaire Median Male Earnings Correlation Chart
The statistical analysis conducted on geographies consisting of 45,775,457 people shows a significant negative correlation between the proportion of Menominee and median male earnings in the United States with a correlation coefficient (R) of -0.622 and weighted average of $42,581. Similarly, the statistical analysis conducted on geographies consisting of 107,252,506 people shows a moderate positive correlation between the proportion of Immigrants from Zaire and median male earnings in the United States with a correlation coefficient (R) of 0.442 and weighted average of $47,070, a difference of 10.5%.
Median Male Earnings Correlation Summary
| Measurement | Menominee | Immigrants from Zaire |
| Minimum | $23,828 | $7,065 |
| Maximum | $75,000 | $98,750 |
| Range | $51,172 | $91,685 |
| Mean | $39,395 | $46,699 |
| Median | $38,495 | $44,438 |
| Interquartile 25% (IQ1) | $29,844 | $40,386 |
| Interquartile 75% (IQ3) | $45,222 | $50,511 |
| Interquartile Range (IQR) | $15,378 | $10,125 |
| Standard Deviation (Sample) | $10,853 | $16,725 |
| Standard Deviation (Population) | $10,643 | $16,434 |
Similar Demographics by Median Male Earnings
Demographics Similar to Menominee by Median Male Earnings
In terms of median male earnings, the demographic groups most similar to Menominee are Crow ($42,434, a difference of 0.35%), Pima ($42,357, a difference of 0.53%), Navajo ($42,098, a difference of 1.1%), Hopi ($42,060, a difference of 1.2%), and Arapaho ($41,758, a difference of 2.0%).
| Demographics | Rating | Rank | Median Male Earnings |
| Immigrants | Mexico | 0.0 /100 | #330 | Tragic $44,960 |
| Natives/Alaskans | 0.0 /100 | #331 | Tragic $44,775 |
| Bahamians | 0.0 /100 | #332 | Tragic $44,756 |
| Immigrants | Congo | 0.0 /100 | #333 | Tragic $44,204 |
| Immigrants | Yemen | 0.0 /100 | #334 | Tragic $44,083 |
| Spanish American Indians | 0.0 /100 | #335 | Tragic $44,010 |
| Immigrants | Cuba | 0.0 /100 | #336 | Tragic $43,461 |
| Menominee | 0.0 /100 | #337 | Tragic $42,581 |
| Crow | 0.0 /100 | #338 | Tragic $42,434 |
| Pima | 0.0 /100 | #339 | Tragic $42,357 |
| Navajo | 0.0 /100 | #340 | Tragic $42,098 |
| Hopi | 0.0 /100 | #341 | Tragic $42,060 |
| Arapaho | 0.0 /100 | #342 | Tragic $41,758 |
| Lumbee | 0.0 /100 | #343 | Tragic $41,715 |
| Pueblo | 0.0 /100 | #344 | Tragic $41,314 |
Demographics Similar to Immigrants from Zaire by Median Male Earnings
In terms of median male earnings, the demographic groups most similar to Immigrants from Zaire are U.S. Virgin Islander ($47,066, a difference of 0.010%), Immigrants from Micronesia ($47,177, a difference of 0.23%), Dominican ($47,204, a difference of 0.28%), Immigrants from Latin America ($46,941, a difference of 0.28%), and Inupiat ($47,281, a difference of 0.45%).
| Demographics | Rating | Rank | Median Male Earnings |
| Immigrants | Dominica | 0.1 /100 | #292 | Tragic $47,651 |
| Indonesians | 0.1 /100 | #293 | Tragic $47,503 |
| Immigrants | Nicaragua | 0.1 /100 | #294 | Tragic $47,482 |
| Central American Indians | 0.1 /100 | #295 | Tragic $47,433 |
| Inupiat | 0.1 /100 | #296 | Tragic $47,281 |
| Dominicans | 0.1 /100 | #297 | Tragic $47,204 |
| Immigrants | Micronesia | 0.1 /100 | #298 | Tragic $47,177 |
| Immigrants | Zaire | 0.1 /100 | #299 | Tragic $47,070 |
| U.S. Virgin Islanders | 0.1 /100 | #300 | Tragic $47,066 |
| Immigrants | Latin America | 0.1 /100 | #301 | Tragic $46,941 |
| Seminole | 0.1 /100 | #302 | Tragic $46,783 |
| Yaqui | 0.1 /100 | #303 | Tragic $46,777 |
| Bangladeshis | 0.1 /100 | #304 | Tragic $46,744 |
| Guatemalans | 0.0 /100 | #305 | Tragic $46,736 |
| Dutch West Indians | 0.0 /100 | #306 | Tragic $46,656 |