Spanish American vs Immigrants from Grenada Median Male Earnings
COMPARE
Spanish American
Immigrants from Grenada
Median Male Earnings
Median Male Earnings Comparison
Spanish Americans
Immigrants from Grenada
$49,008
MEDIAN MALE EARNINGS
0.5/ 100
METRIC RATING
267th/ 347
METRIC RANK
$50,279
MEDIAN MALE EARNINGS
1.6/ 100
METRIC RATING
251st/ 347
METRIC RANK
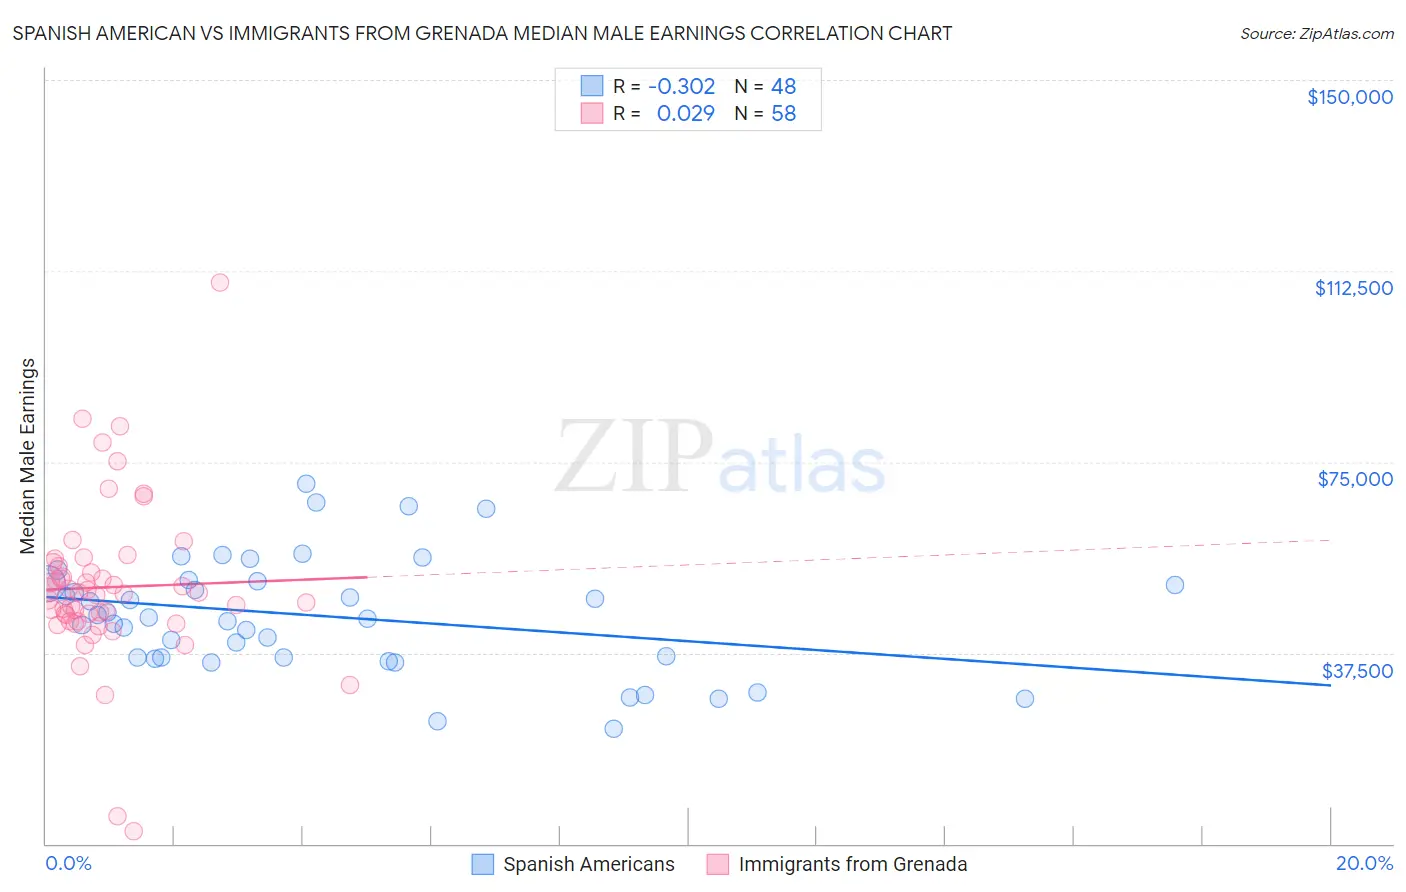
Spanish American vs Immigrants from Grenada Median Male Earnings Correlation Chart
The statistical analysis conducted on geographies consisting of 103,156,664 people shows a mild negative correlation between the proportion of Spanish Americans and median male earnings in the United States with a correlation coefficient (R) of -0.302 and weighted average of $49,008. Similarly, the statistical analysis conducted on geographies consisting of 67,198,306 people shows no correlation between the proportion of Immigrants from Grenada and median male earnings in the United States with a correlation coefficient (R) of 0.029 and weighted average of $50,279, a difference of 2.6%.
Median Male Earnings Correlation Summary
| Measurement | Spanish American | Immigrants from Grenada |
| Minimum | $22,500 | $2,499 |
| Maximum | $70,678 | $110,313 |
| Range | $48,178 | $107,814 |
| Mean | $44,710 | $50,381 |
| Median | $44,270 | $49,246 |
| Interquartile 25% (IQ1) | $36,560 | $43,797 |
| Interquartile 75% (IQ3) | $51,208 | $54,582 |
| Interquartile Range (IQR) | $14,648 | $10,785 |
| Standard Deviation (Sample) | $11,259 | $16,114 |
| Standard Deviation (Population) | $11,141 | $15,975 |
Demographics Similar to Spanish Americans and Immigrants from Grenada by Median Male Earnings
In terms of median male earnings, the demographic groups most similar to Spanish Americans are Somali ($49,025, a difference of 0.040%), Ute ($48,899, a difference of 0.22%), Tsimshian ($48,836, a difference of 0.35%), Immigrants from Laos ($49,190, a difference of 0.37%), and Immigrants from Middle Africa ($49,201, a difference of 0.39%). Similarly, the demographic groups most similar to Immigrants from Grenada are Osage ($50,292, a difference of 0.020%), Immigrants from Burma/Myanmar ($50,298, a difference of 0.040%), Immigrants from Cabo Verde ($50,009, a difference of 0.54%), German Russian ($49,924, a difference of 0.71%), and Senegalese ($49,774, a difference of 1.0%).
| Demographics | Rating | Rank | Median Male Earnings |
| Immigrants | Burma/Myanmar | 1.6 /100 | #249 | Tragic $50,298 |
| Osage | 1.6 /100 | #250 | Tragic $50,292 |
| Immigrants | Grenada | 1.6 /100 | #251 | Tragic $50,279 |
| Immigrants | Cabo Verde | 1.2 /100 | #252 | Tragic $50,009 |
| German Russians | 1.1 /100 | #253 | Tragic $49,924 |
| Senegalese | 1.0 /100 | #254 | Tragic $49,774 |
| Alaskan Athabascans | 0.9 /100 | #255 | Tragic $49,748 |
| Alaska Natives | 0.9 /100 | #256 | Tragic $49,711 |
| British West Indians | 0.8 /100 | #257 | Tragic $49,636 |
| Cree | 0.7 /100 | #258 | Tragic $49,497 |
| Nepalese | 0.7 /100 | #259 | Tragic $49,458 |
| Iroquois | 0.7 /100 | #260 | Tragic $49,374 |
| Liberians | 0.6 /100 | #261 | Tragic $49,318 |
| Immigrants | West Indies | 0.6 /100 | #262 | Tragic $49,271 |
| Nicaraguans | 0.6 /100 | #263 | Tragic $49,215 |
| Immigrants | Middle Africa | 0.6 /100 | #264 | Tragic $49,201 |
| Immigrants | Laos | 0.6 /100 | #265 | Tragic $49,190 |
| Somalis | 0.5 /100 | #266 | Tragic $49,025 |
| Spanish Americans | 0.5 /100 | #267 | Tragic $49,008 |
| Ute | 0.4 /100 | #268 | Tragic $48,899 |
| Tsimshian | 0.4 /100 | #269 | Tragic $48,836 |