Immigrants from Israel vs Immigrants from Grenada Median Male Earnings
COMPARE
Immigrants from Israel
Immigrants from Grenada
Median Male Earnings
Median Male Earnings Comparison
Immigrants from Israel
Immigrants from Grenada
$68,716
MEDIAN MALE EARNINGS
100.0/ 100
METRIC RATING
10th/ 347
METRIC RANK
$50,279
MEDIAN MALE EARNINGS
1.6/ 100
METRIC RATING
251st/ 347
METRIC RANK
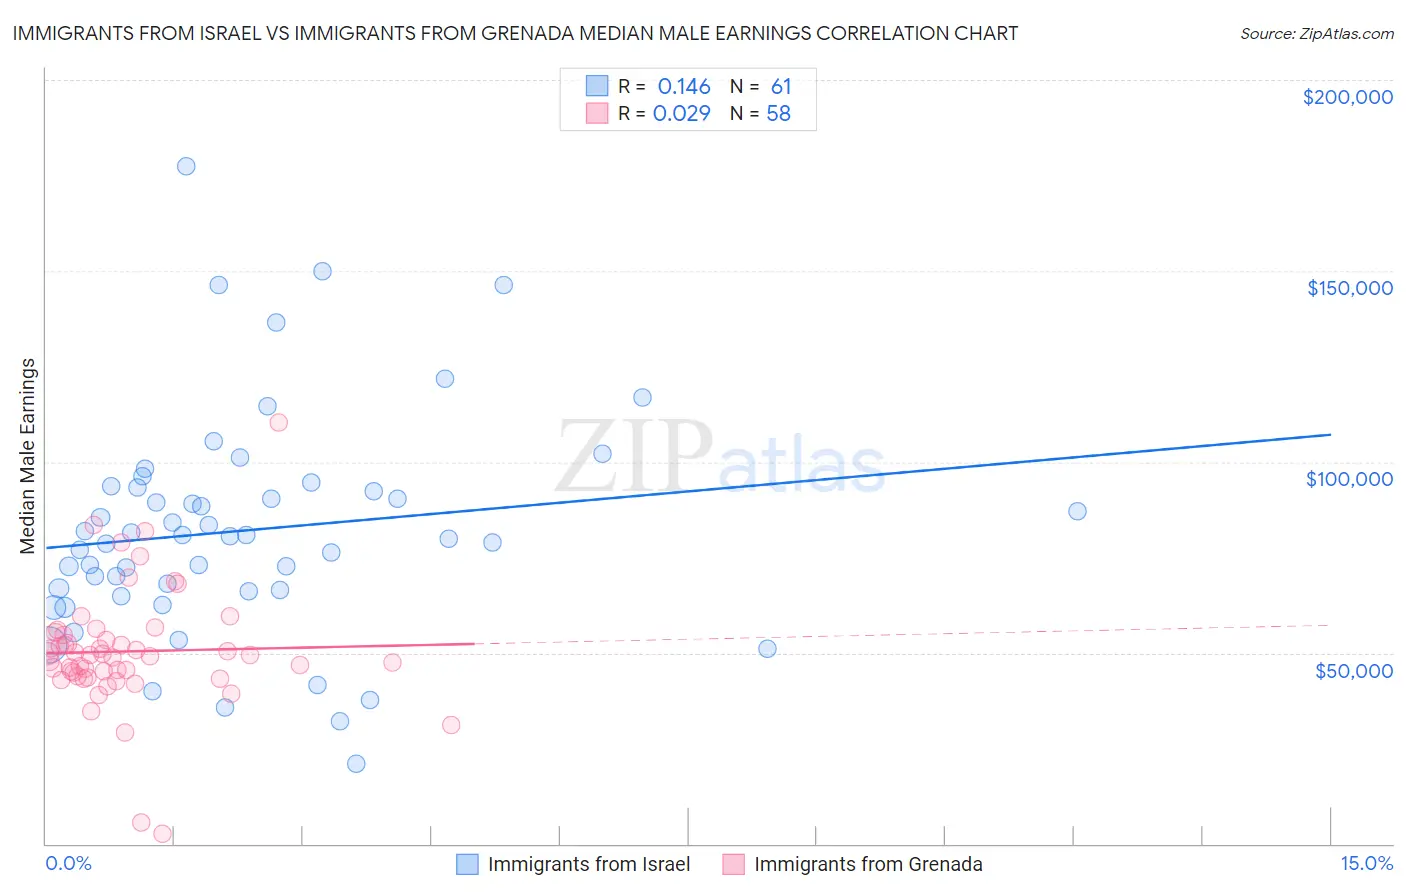
Immigrants from Israel vs Immigrants from Grenada Median Male Earnings Correlation Chart
The statistical analysis conducted on geographies consisting of 209,997,525 people shows a poor positive correlation between the proportion of Immigrants from Israel and median male earnings in the United States with a correlation coefficient (R) of 0.146 and weighted average of $68,716. Similarly, the statistical analysis conducted on geographies consisting of 67,198,306 people shows no correlation between the proportion of Immigrants from Grenada and median male earnings in the United States with a correlation coefficient (R) of 0.029 and weighted average of $50,279, a difference of 36.7%.
Median Male Earnings Correlation Summary
| Measurement | Immigrants from Israel | Immigrants from Grenada |
| Minimum | $21,056 | $2,499 |
| Maximum | $177,500 | $110,313 |
| Range | $156,444 | $107,814 |
| Mean | $82,160 | $50,381 |
| Median | $80,676 | $49,246 |
| Interquartile 25% (IQ1) | $66,232 | $43,797 |
| Interquartile 75% (IQ3) | $93,582 | $54,582 |
| Interquartile Range (IQR) | $27,350 | $10,785 |
| Standard Deviation (Sample) | $29,382 | $16,114 |
| Standard Deviation (Population) | $29,141 | $15,975 |
Similar Demographics by Median Male Earnings
Demographics Similar to Immigrants from Israel by Median Male Earnings
In terms of median male earnings, the demographic groups most similar to Immigrants from Israel are Immigrants from South Central Asia ($68,960, a difference of 0.35%), Immigrants from Iran ($69,284, a difference of 0.83%), Immigrants from Ireland ($67,698, a difference of 1.5%), Immigrants from Australia ($67,634, a difference of 1.6%), and Immigrants from China ($67,353, a difference of 2.0%).
| Demographics | Rating | Rank | Median Male Earnings |
| Immigrants | Taiwan | 100.0 /100 | #3 | Exceptional $74,031 |
| Thais | 100.0 /100 | #4 | Exceptional $72,135 |
| Immigrants | Singapore | 100.0 /100 | #5 | Exceptional $71,348 |
| Iranians | 100.0 /100 | #6 | Exceptional $70,648 |
| Immigrants | Hong Kong | 100.0 /100 | #7 | Exceptional $70,146 |
| Immigrants | Iran | 100.0 /100 | #8 | Exceptional $69,284 |
| Immigrants | South Central Asia | 100.0 /100 | #9 | Exceptional $68,960 |
| Immigrants | Israel | 100.0 /100 | #10 | Exceptional $68,716 |
| Immigrants | Ireland | 100.0 /100 | #11 | Exceptional $67,698 |
| Immigrants | Australia | 100.0 /100 | #12 | Exceptional $67,634 |
| Immigrants | China | 100.0 /100 | #13 | Exceptional $67,353 |
| Okinawans | 100.0 /100 | #14 | Exceptional $67,232 |
| Immigrants | Eastern Asia | 100.0 /100 | #15 | Exceptional $66,903 |
| Eastern Europeans | 100.0 /100 | #16 | Exceptional $66,472 |
| Immigrants | Belgium | 100.0 /100 | #17 | Exceptional $66,125 |
Demographics Similar to Immigrants from Grenada by Median Male Earnings
In terms of median male earnings, the demographic groups most similar to Immigrants from Grenada are Osage ($50,292, a difference of 0.020%), Immigrants from Burma/Myanmar ($50,298, a difference of 0.040%), Immigrants from Guyana ($50,321, a difference of 0.080%), Subsaharan African ($50,408, a difference of 0.26%), and Immigrants from Ecuador ($50,474, a difference of 0.39%).
| Demographics | Rating | Rank | Median Male Earnings |
| Houma | 2.0 /100 | #244 | Tragic $50,547 |
| Hawaiians | 1.9 /100 | #245 | Tragic $50,488 |
| Immigrants | Ecuador | 1.9 /100 | #246 | Tragic $50,474 |
| Sub-Saharan Africans | 1.8 /100 | #247 | Tragic $50,408 |
| Immigrants | Guyana | 1.6 /100 | #248 | Tragic $50,321 |
| Immigrants | Burma/Myanmar | 1.6 /100 | #249 | Tragic $50,298 |
| Osage | 1.6 /100 | #250 | Tragic $50,292 |
| Immigrants | Grenada | 1.6 /100 | #251 | Tragic $50,279 |
| Immigrants | Cabo Verde | 1.2 /100 | #252 | Tragic $50,009 |
| German Russians | 1.1 /100 | #253 | Tragic $49,924 |
| Senegalese | 1.0 /100 | #254 | Tragic $49,774 |
| Alaskan Athabascans | 0.9 /100 | #255 | Tragic $49,748 |
| Alaska Natives | 0.9 /100 | #256 | Tragic $49,711 |
| British West Indians | 0.8 /100 | #257 | Tragic $49,636 |
| Cree | 0.7 /100 | #258 | Tragic $49,497 |