Menominee vs Immigrants from Bangladesh Unemployment Among Ages 35 to 44 years
COMPARE
Menominee
Immigrants from Bangladesh
Unemployment Among Ages 35 to 44 years
Unemployment Among Ages 35 to 44 years Comparison
Menominee
Immigrants from Bangladesh
6.5%
UNEMPLOYMENT AMONG AGES 35 TO 44 YEARS
0.0/ 100
METRIC RATING
324th/ 347
METRIC RANK
5.3%
UNEMPLOYMENT AMONG AGES 35 TO 44 YEARS
0.1/ 100
METRIC RATING
266th/ 347
METRIC RANK
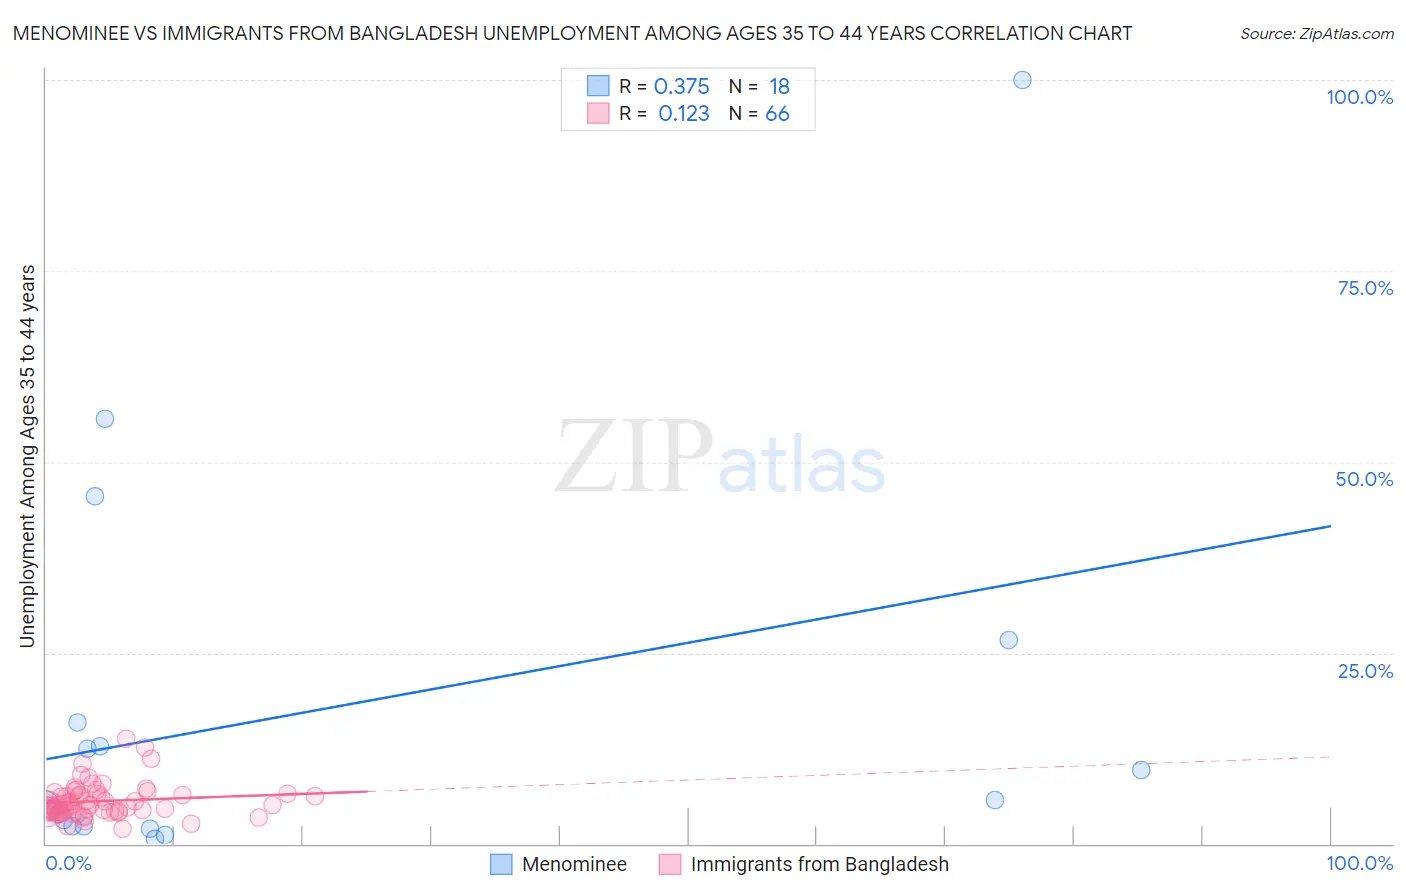
Menominee vs Immigrants from Bangladesh Unemployment Among Ages 35 to 44 years Correlation Chart
The statistical analysis conducted on geographies consisting of 45,418,932 people shows a mild positive correlation between the proportion of Menominee and unemployment rate among population between the ages 35 and 44 in the United States with a correlation coefficient (R) of 0.375 and weighted average of 6.5%. Similarly, the statistical analysis conducted on geographies consisting of 202,422,179 people shows a poor positive correlation between the proportion of Immigrants from Bangladesh and unemployment rate among population between the ages 35 and 44 in the United States with a correlation coefficient (R) of 0.123 and weighted average of 5.3%, a difference of 22.8%.
Unemployment Among Ages 35 to 44 years Correlation Summary
| Measurement | Menominee | Immigrants from Bangladesh |
| Minimum | 0.60% | 1.9% |
| Maximum | 100.0% | 13.7% |
| Range | 99.4% | 11.8% |
| Mean | 17.2% | 5.6% |
| Median | 5.4% | 5.0% |
| Interquartile 25% (IQ1) | 2.3% | 4.2% |
| Interquartile 75% (IQ3) | 15.9% | 6.5% |
| Interquartile Range (IQR) | 13.6% | 2.3% |
| Standard Deviation (Sample) | 25.8% | 2.2% |
| Standard Deviation (Population) | 25.1% | 2.2% |
Similar Demographics by Unemployment Among Ages 35 to 44 years
Demographics Similar to Menominee by Unemployment Among Ages 35 to 44 years
In terms of unemployment among ages 35 to 44 years, the demographic groups most similar to Menominee are Immigrants from Yemen (6.6%, a difference of 0.36%), Alaska Native (6.6%, a difference of 0.43%), Cape Verdean (6.6%, a difference of 0.47%), Shoshone (6.6%, a difference of 1.2%), and Dominican (6.4%, a difference of 1.6%).
| Demographics | Rating | Rank | Unemployment Among Ages 35 to 44 years |
| Immigrants | St. Vincent and the Grenadines | 0.0 /100 | #317 | Tragic 6.2% |
| Colville | 0.0 /100 | #318 | Tragic 6.2% |
| Immigrants | Grenada | 0.0 /100 | #319 | Tragic 6.2% |
| Immigrants | Armenia | 0.0 /100 | #320 | Tragic 6.2% |
| Chippewa | 0.0 /100 | #321 | Tragic 6.2% |
| Immigrants | Dominican Republic | 0.0 /100 | #322 | Tragic 6.4% |
| Dominicans | 0.0 /100 | #323 | Tragic 6.4% |
| Menominee | 0.0 /100 | #324 | Tragic 6.5% |
| Immigrants | Yemen | 0.0 /100 | #325 | Tragic 6.6% |
| Alaska Natives | 0.0 /100 | #326 | Tragic 6.6% |
| Cape Verdeans | 0.0 /100 | #327 | Tragic 6.6% |
| Shoshone | 0.0 /100 | #328 | Tragic 6.6% |
| Paiute | 0.0 /100 | #329 | Tragic 6.9% |
| Immigrants | Cabo Verde | 0.0 /100 | #330 | Tragic 6.9% |
| Pueblo | 0.0 /100 | #331 | Tragic 7.1% |
Demographics Similar to Immigrants from Bangladesh by Unemployment Among Ages 35 to 44 years
In terms of unemployment among ages 35 to 44 years, the demographic groups most similar to Immigrants from Bangladesh are Yaqui (5.3%, a difference of 0.020%), Immigrants from Western Africa (5.3%, a difference of 0.13%), Hawaiian (5.3%, a difference of 0.20%), Choctaw (5.3%, a difference of 0.21%), and Ghanaian (5.3%, a difference of 0.21%).
| Demographics | Rating | Rank | Unemployment Among Ages 35 to 44 years |
| Mexicans | 0.1 /100 | #259 | Tragic 5.3% |
| Sub-Saharan Africans | 0.1 /100 | #260 | Tragic 5.3% |
| Spanish Americans | 0.1 /100 | #261 | Tragic 5.3% |
| Immigrants | Central America | 0.1 /100 | #262 | Tragic 5.3% |
| Choctaw | 0.1 /100 | #263 | Tragic 5.3% |
| Ghanaians | 0.1 /100 | #264 | Tragic 5.3% |
| Yaqui | 0.1 /100 | #265 | Tragic 5.3% |
| Immigrants | Bangladesh | 0.1 /100 | #266 | Tragic 5.3% |
| Immigrants | Western Africa | 0.0 /100 | #267 | Tragic 5.3% |
| Hawaiians | 0.0 /100 | #268 | Tragic 5.3% |
| Cajuns | 0.0 /100 | #269 | Tragic 5.3% |
| Blackfeet | 0.0 /100 | #270 | Tragic 5.3% |
| Ute | 0.0 /100 | #271 | Tragic 5.3% |
| Senegalese | 0.0 /100 | #272 | Tragic 5.3% |
| Vietnamese | 0.0 /100 | #273 | Tragic 5.4% |