Marshallese vs Immigrants from Micronesia Hearing Disability
COMPARE
Marshallese
Immigrants from Micronesia
Hearing Disability
Hearing Disability Comparison
Marshallese
Immigrants from Micronesia
3.8%
HEARING DISABILITY
0.0/ 100
METRIC RATING
306th/ 347
METRIC RANK
3.6%
HEARING DISABILITY
0.0/ 100
METRIC RATING
284th/ 347
METRIC RANK
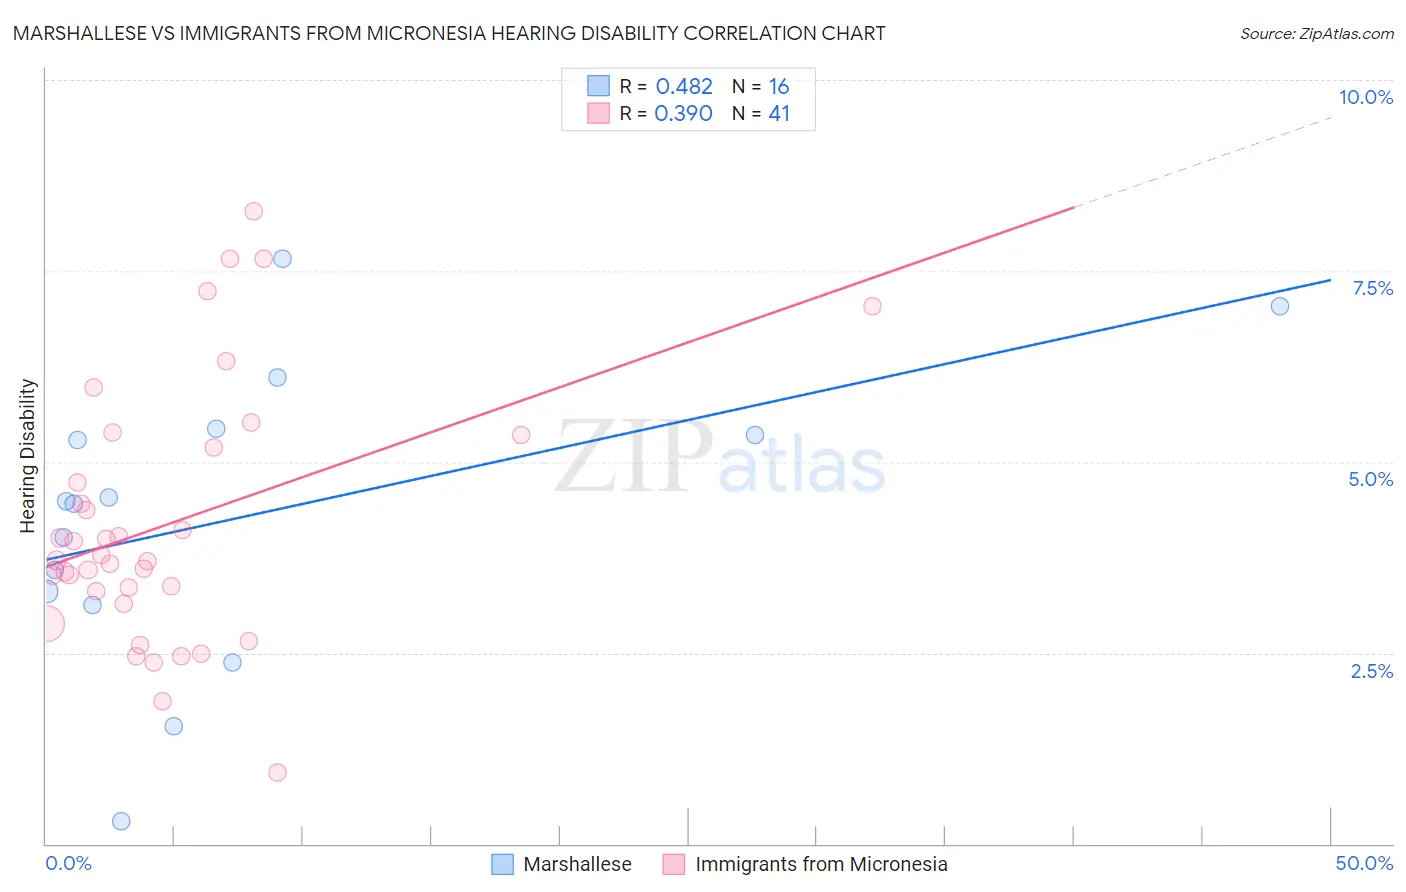
Marshallese vs Immigrants from Micronesia Hearing Disability Correlation Chart
The statistical analysis conducted on geographies consisting of 14,761,315 people shows a moderate positive correlation between the proportion of Marshallese and percentage of population with hearing disability in the United States with a correlation coefficient (R) of 0.482 and weighted average of 3.8%. Similarly, the statistical analysis conducted on geographies consisting of 61,571,730 people shows a mild positive correlation between the proportion of Immigrants from Micronesia and percentage of population with hearing disability in the United States with a correlation coefficient (R) of 0.390 and weighted average of 3.6%, a difference of 4.7%.
Hearing Disability Correlation Summary
| Measurement | Marshallese | Immigrants from Micronesia |
| Minimum | 0.29% | 0.94% |
| Maximum | 7.7% | 8.3% |
| Range | 7.4% | 7.3% |
| Mean | 4.3% | 4.2% |
| Median | 4.5% | 3.7% |
| Interquartile 25% (IQ1) | 3.2% | 3.2% |
| Interquartile 75% (IQ3) | 5.4% | 5.3% |
| Interquartile Range (IQR) | 2.2% | 2.0% |
| Standard Deviation (Sample) | 1.9% | 1.7% |
| Standard Deviation (Population) | 1.9% | 1.7% |
Similar Demographics by Hearing Disability
Demographics Similar to Marshallese by Hearing Disability
In terms of hearing disability, the demographic groups most similar to Marshallese are French Canadian (3.8%, a difference of 0.12%), Ottawa (3.8%, a difference of 0.56%), Scotch-Irish (3.8%, a difference of 0.64%), English (3.8%, a difference of 0.86%), and Cree (3.8%, a difference of 0.95%).
| Demographics | Rating | Rank | Hearing Disability |
| Germans | 0.0 /100 | #299 | Tragic 3.7% |
| Scottish | 0.0 /100 | #300 | Tragic 3.7% |
| Pennsylvania Germans | 0.0 /100 | #301 | Tragic 3.7% |
| Dutch | 0.0 /100 | #302 | Tragic 3.7% |
| Menominee | 0.0 /100 | #303 | Tragic 3.7% |
| French | 0.0 /100 | #304 | Tragic 3.8% |
| English | 0.0 /100 | #305 | Tragic 3.8% |
| Marshallese | 0.0 /100 | #306 | Tragic 3.8% |
| French Canadians | 0.0 /100 | #307 | Tragic 3.8% |
| Ottawa | 0.0 /100 | #308 | Tragic 3.8% |
| Scotch-Irish | 0.0 /100 | #309 | Tragic 3.8% |
| Cree | 0.0 /100 | #310 | Tragic 3.8% |
| Americans | 0.0 /100 | #311 | Tragic 3.9% |
| Cajuns | 0.0 /100 | #312 | Tragic 3.9% |
| Hopi | 0.0 /100 | #313 | Tragic 3.9% |
Demographics Similar to Immigrants from Micronesia by Hearing Disability
In terms of hearing disability, the demographic groups most similar to Immigrants from Micronesia are Sioux (3.6%, a difference of 0.10%), Delaware (3.6%, a difference of 0.13%), Spanish (3.7%, a difference of 0.38%), Blackfeet (3.6%, a difference of 0.47%), and Swedish (3.6%, a difference of 0.72%).
| Demographics | Rating | Rank | Hearing Disability |
| Immigrants | Nonimmigrants | 0.0 /100 | #277 | Tragic 3.6% |
| Basques | 0.0 /100 | #278 | Tragic 3.6% |
| Slovaks | 0.0 /100 | #279 | Tragic 3.6% |
| French American Indians | 0.0 /100 | #280 | Tragic 3.6% |
| Scandinavians | 0.0 /100 | #281 | Tragic 3.6% |
| Swedes | 0.0 /100 | #282 | Tragic 3.6% |
| Blackfeet | 0.0 /100 | #283 | Tragic 3.6% |
| Immigrants | Micronesia | 0.0 /100 | #284 | Tragic 3.6% |
| Sioux | 0.0 /100 | #285 | Tragic 3.6% |
| Delaware | 0.0 /100 | #286 | Tragic 3.6% |
| Spanish | 0.0 /100 | #287 | Tragic 3.7% |
| Irish | 0.0 /100 | #288 | Tragic 3.7% |
| Chinese | 0.0 /100 | #289 | Tragic 3.7% |
| Whites/Caucasians | 0.0 /100 | #290 | Tragic 3.7% |
| Finns | 0.0 /100 | #291 | Tragic 3.7% |