Marshallese vs Immigrants from Yemen Median Family Income
COMPARE
Marshallese
Immigrants from Yemen
Median Family Income
Median Family Income Comparison
Marshallese
Immigrants from Yemen
$95,293
MEDIAN FAMILY INCOME
2.2/ 100
METRIC RATING
229th/ 347
METRIC RANK
$77,457
MEDIAN FAMILY INCOME
0.0/ 100
METRIC RATING
338th/ 347
METRIC RANK
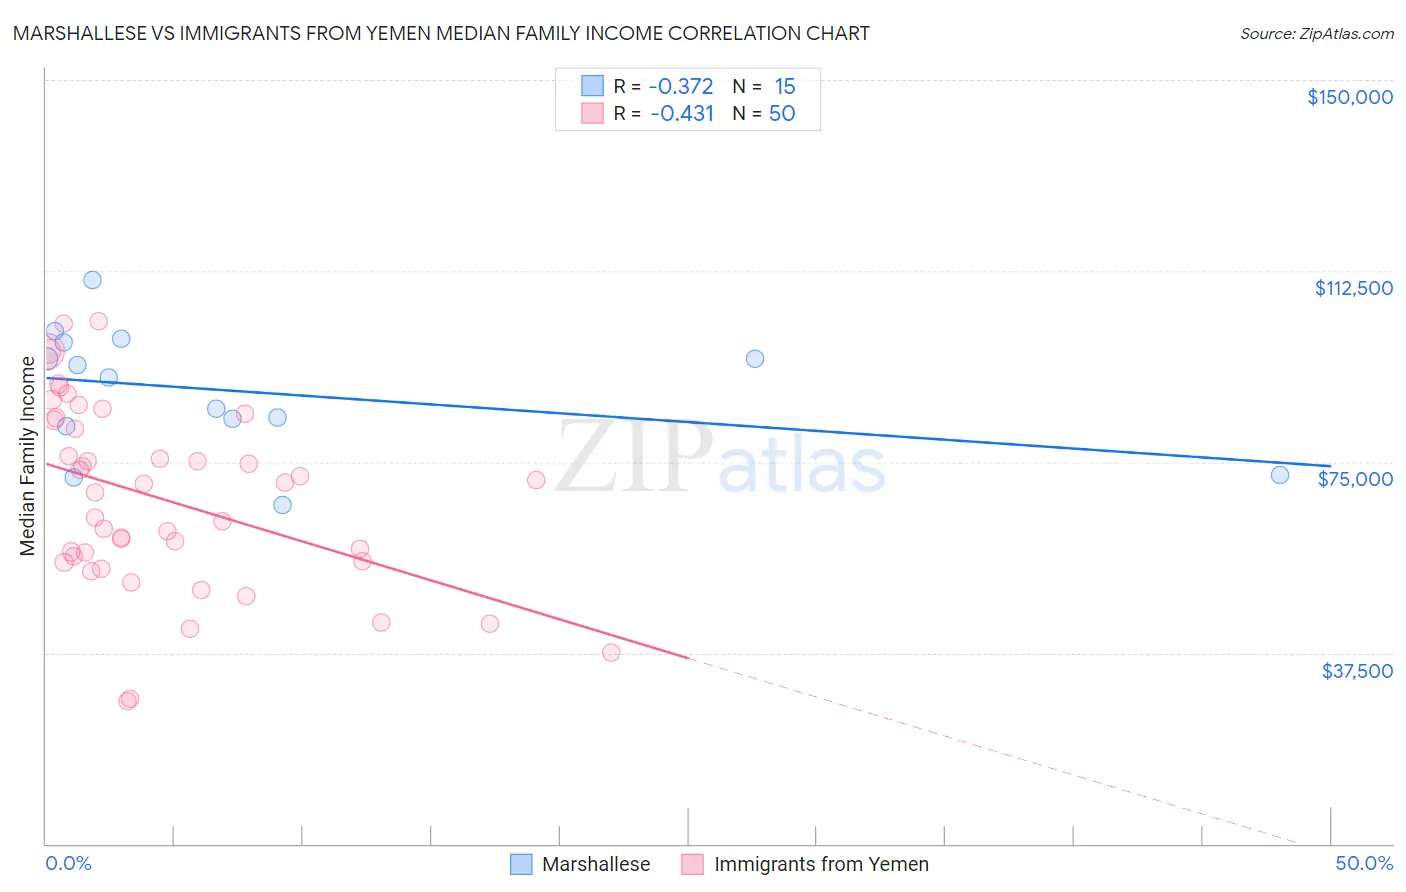
Marshallese vs Immigrants from Yemen Median Family Income Correlation Chart
The statistical analysis conducted on geographies consisting of 14,760,991 people shows a mild negative correlation between the proportion of Marshallese and median family income in the United States with a correlation coefficient (R) of -0.372 and weighted average of $95,293. Similarly, the statistical analysis conducted on geographies consisting of 82,428,654 people shows a moderate negative correlation between the proportion of Immigrants from Yemen and median family income in the United States with a correlation coefficient (R) of -0.431 and weighted average of $77,457, a difference of 23.0%.
Median Family Income Correlation Summary
| Measurement | Marshallese | Immigrants from Yemen |
| Minimum | $66,563 | $28,000 |
| Maximum | $110,724 | $102,670 |
| Range | $44,161 | $74,670 |
| Mean | $88,730 | $67,712 |
| Median | $91,530 | $69,869 |
| Interquartile 25% (IQ1) | $81,946 | $55,430 |
| Interquartile 75% (IQ3) | $98,411 | $83,169 |
| Interquartile Range (IQR) | $16,465 | $27,739 |
| Standard Deviation (Sample) | $12,233 | $18,166 |
| Standard Deviation (Population) | $11,818 | $17,984 |
Similar Demographics by Median Family Income
Demographics Similar to Marshallese by Median Family Income
In terms of median family income, the demographic groups most similar to Marshallese are Malaysian ($95,230, a difference of 0.070%), Immigrants from the Azores ($95,402, a difference of 0.11%), Ecuadorian ($95,114, a difference of 0.19%), Alaska Native ($95,573, a difference of 0.29%), and Immigrants from Panama ($95,647, a difference of 0.37%).
| Demographics | Rating | Rank | Median Family Income |
| Immigrants | Nigeria | 4.0 /100 | #222 | Tragic $96,439 |
| Venezuelans | 3.7 /100 | #223 | Tragic $96,281 |
| Immigrants | Nonimmigrants | 3.6 /100 | #224 | Tragic $96,231 |
| Vietnamese | 3.4 /100 | #225 | Tragic $96,123 |
| Immigrants | Panama | 2.7 /100 | #226 | Tragic $95,647 |
| Alaska Natives | 2.6 /100 | #227 | Tragic $95,573 |
| Immigrants | Azores | 2.4 /100 | #228 | Tragic $95,402 |
| Marshallese | 2.2 /100 | #229 | Tragic $95,293 |
| Malaysians | 2.2 /100 | #230 | Tragic $95,230 |
| Ecuadorians | 2.1 /100 | #231 | Tragic $95,114 |
| Immigrants | Venezuela | 1.9 /100 | #232 | Tragic $94,904 |
| Immigrants | Bangladesh | 1.6 /100 | #233 | Tragic $94,665 |
| Immigrants | Western Africa | 1.6 /100 | #234 | Tragic $94,638 |
| Immigrants | Burma/Myanmar | 1.5 /100 | #235 | Tragic $94,472 |
| Trinidadians and Tobagonians | 1.5 /100 | #236 | Tragic $94,466 |
Demographics Similar to Immigrants from Yemen by Median Family Income
In terms of median family income, the demographic groups most similar to Immigrants from Yemen are Pima ($77,431, a difference of 0.030%), Hopi ($77,188, a difference of 0.35%), Pueblo ($76,880, a difference of 0.75%), Yuman ($78,055, a difference of 0.77%), and Immigrants from Cuba ($78,249, a difference of 1.0%).
| Demographics | Rating | Rank | Median Family Income |
| Immigrants | Dominican Republic | 0.0 /100 | #331 | Tragic $81,233 |
| Natives/Alaskans | 0.0 /100 | #332 | Tragic $80,908 |
| Kiowa | 0.0 /100 | #333 | Tragic $80,885 |
| Menominee | 0.0 /100 | #334 | Tragic $79,563 |
| Yup'ik | 0.0 /100 | #335 | Tragic $79,290 |
| Immigrants | Cuba | 0.0 /100 | #336 | Tragic $78,249 |
| Yuman | 0.0 /100 | #337 | Tragic $78,055 |
| Immigrants | Yemen | 0.0 /100 | #338 | Tragic $77,457 |
| Pima | 0.0 /100 | #339 | Tragic $77,431 |
| Hopi | 0.0 /100 | #340 | Tragic $77,188 |
| Pueblo | 0.0 /100 | #341 | Tragic $76,880 |
| Crow | 0.0 /100 | #342 | Tragic $76,605 |
| Houma | 0.0 /100 | #343 | Tragic $76,188 |
| Tohono O'odham | 0.0 /100 | #344 | Tragic $72,193 |
| Navajo | 0.0 /100 | #345 | Tragic $70,989 |