Marshallese vs Immigrants from the Azores Median Female Earnings
COMPARE
Marshallese
Immigrants from the Azores
Median Female Earnings
Median Female Earnings Comparison
Marshallese
Immigrants from the Azores
$36,459
MEDIAN FEMALE EARNINGS
0.1/ 100
METRIC RATING
277th/ 347
METRIC RANK
$38,573
MEDIAN FEMALE EARNINGS
8.8/ 100
METRIC RATING
221st/ 347
METRIC RANK
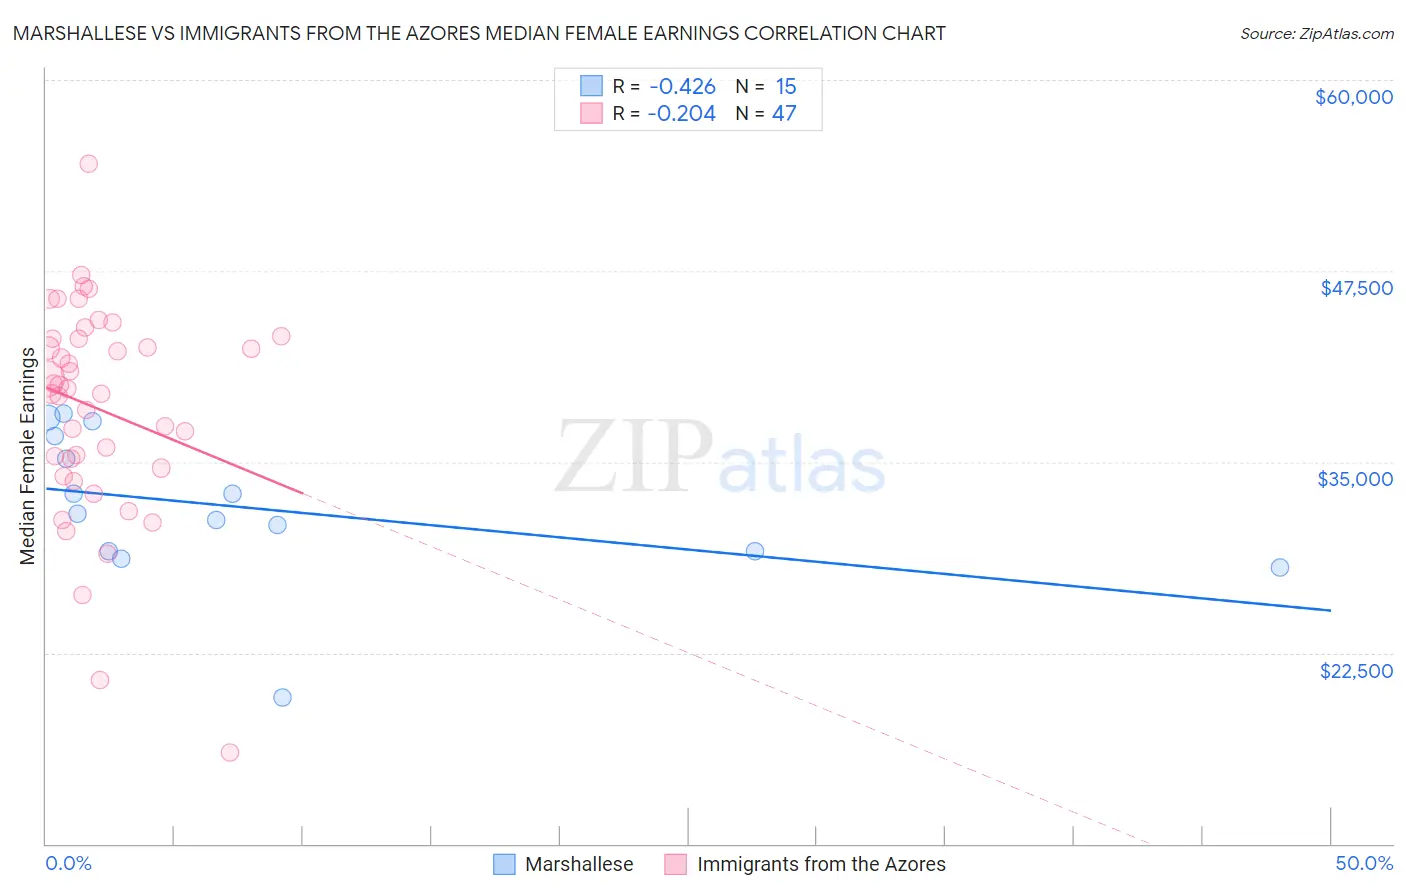
Marshallese vs Immigrants from the Azores Median Female Earnings Correlation Chart
The statistical analysis conducted on geographies consisting of 14,760,991 people shows a moderate negative correlation between the proportion of Marshallese and median female earnings in the United States with a correlation coefficient (R) of -0.426 and weighted average of $36,459. Similarly, the statistical analysis conducted on geographies consisting of 46,252,710 people shows a weak negative correlation between the proportion of Immigrants from the Azores and median female earnings in the United States with a correlation coefficient (R) of -0.204 and weighted average of $38,573, a difference of 5.8%.
Median Female Earnings Correlation Summary
| Measurement | Marshallese | Immigrants from the Azores |
| Minimum | $19,583 | $15,996 |
| Maximum | $38,170 | $54,521 |
| Range | $18,587 | $38,525 |
| Mean | $31,981 | $38,490 |
| Median | $31,627 | $39,828 |
| Interquartile 25% (IQ1) | $29,109 | $34,594 |
| Interquartile 75% (IQ3) | $36,675 | $43,084 |
| Interquartile Range (IQR) | $7,566 | $8,490 |
| Standard Deviation (Sample) | $4,908 | $7,045 |
| Standard Deviation (Population) | $4,742 | $6,970 |
Similar Demographics by Median Female Earnings
Demographics Similar to Marshallese by Median Female Earnings
In terms of median female earnings, the demographic groups most similar to Marshallese are Central American ($36,492, a difference of 0.090%), U.S. Virgin Islander ($36,424, a difference of 0.10%), Immigrants from Caribbean ($36,414, a difference of 0.12%), Iroquois ($36,408, a difference of 0.14%), and African ($36,530, a difference of 0.19%).
| Demographics | Rating | Rank | Median Female Earnings |
| French American Indians | 0.3 /100 | #270 | Tragic $36,920 |
| Nicaraguans | 0.3 /100 | #271 | Tragic $36,904 |
| Immigrants | Dominican Republic | 0.3 /100 | #272 | Tragic $36,857 |
| Immigrants | Laos | 0.3 /100 | #273 | Tragic $36,841 |
| Immigrants | El Salvador | 0.2 /100 | #274 | Tragic $36,673 |
| Africans | 0.1 /100 | #275 | Tragic $36,530 |
| Central Americans | 0.1 /100 | #276 | Tragic $36,492 |
| Marshallese | 0.1 /100 | #277 | Tragic $36,459 |
| U.S. Virgin Islanders | 0.1 /100 | #278 | Tragic $36,424 |
| Immigrants | Caribbean | 0.1 /100 | #279 | Tragic $36,414 |
| Iroquois | 0.1 /100 | #280 | Tragic $36,408 |
| Spanish Americans | 0.1 /100 | #281 | Tragic $36,391 |
| Haitians | 0.1 /100 | #282 | Tragic $36,374 |
| Immigrants | Haiti | 0.1 /100 | #283 | Tragic $36,203 |
| Indonesians | 0.1 /100 | #284 | Tragic $36,140 |
Demographics Similar to Immigrants from the Azores by Median Female Earnings
In terms of median female earnings, the demographic groups most similar to Immigrants from the Azores are Yugoslavian ($38,573, a difference of 0.0%), Nepalese ($38,603, a difference of 0.080%), Cape Verdean ($38,614, a difference of 0.11%), Japanese ($38,528, a difference of 0.12%), and Immigrants from Jamaica ($38,625, a difference of 0.14%).
| Demographics | Rating | Rank | Median Female Earnings |
| Iraqis | 10.5 /100 | #214 | Poor $38,666 |
| Spaniards | 10.3 /100 | #215 | Poor $38,656 |
| Immigrants | Ecuador | 10.1 /100 | #216 | Poor $38,644 |
| Immigrants | Jamaica | 9.7 /100 | #217 | Tragic $38,625 |
| Cape Verdeans | 9.5 /100 | #218 | Tragic $38,614 |
| Nepalese | 9.3 /100 | #219 | Tragic $38,603 |
| Yugoslavians | 8.8 /100 | #220 | Tragic $38,573 |
| Immigrants | Azores | 8.8 /100 | #221 | Tragic $38,573 |
| Japanese | 8.1 /100 | #222 | Tragic $38,528 |
| Immigrants | Sudan | 7.8 /100 | #223 | Tragic $38,511 |
| Native Hawaiians | 7.1 /100 | #224 | Tragic $38,461 |
| French | 7.0 /100 | #225 | Tragic $38,457 |
| French Canadians | 6.8 /100 | #226 | Tragic $38,436 |
| Scottish | 6.3 /100 | #227 | Tragic $38,397 |
| Sub-Saharan Africans | 6.2 /100 | #228 | Tragic $38,391 |