Marshallese vs Puget Sound Salish Median Female Earnings
COMPARE
Marshallese
Puget Sound Salish
Median Female Earnings
Median Female Earnings Comparison
Marshallese
Puget Sound Salish
$36,459
MEDIAN FEMALE EARNINGS
0.1/ 100
METRIC RATING
277th/ 347
METRIC RANK
$39,376
MEDIAN FEMALE EARNINGS
33.9/ 100
METRIC RATING
190th/ 347
METRIC RANK
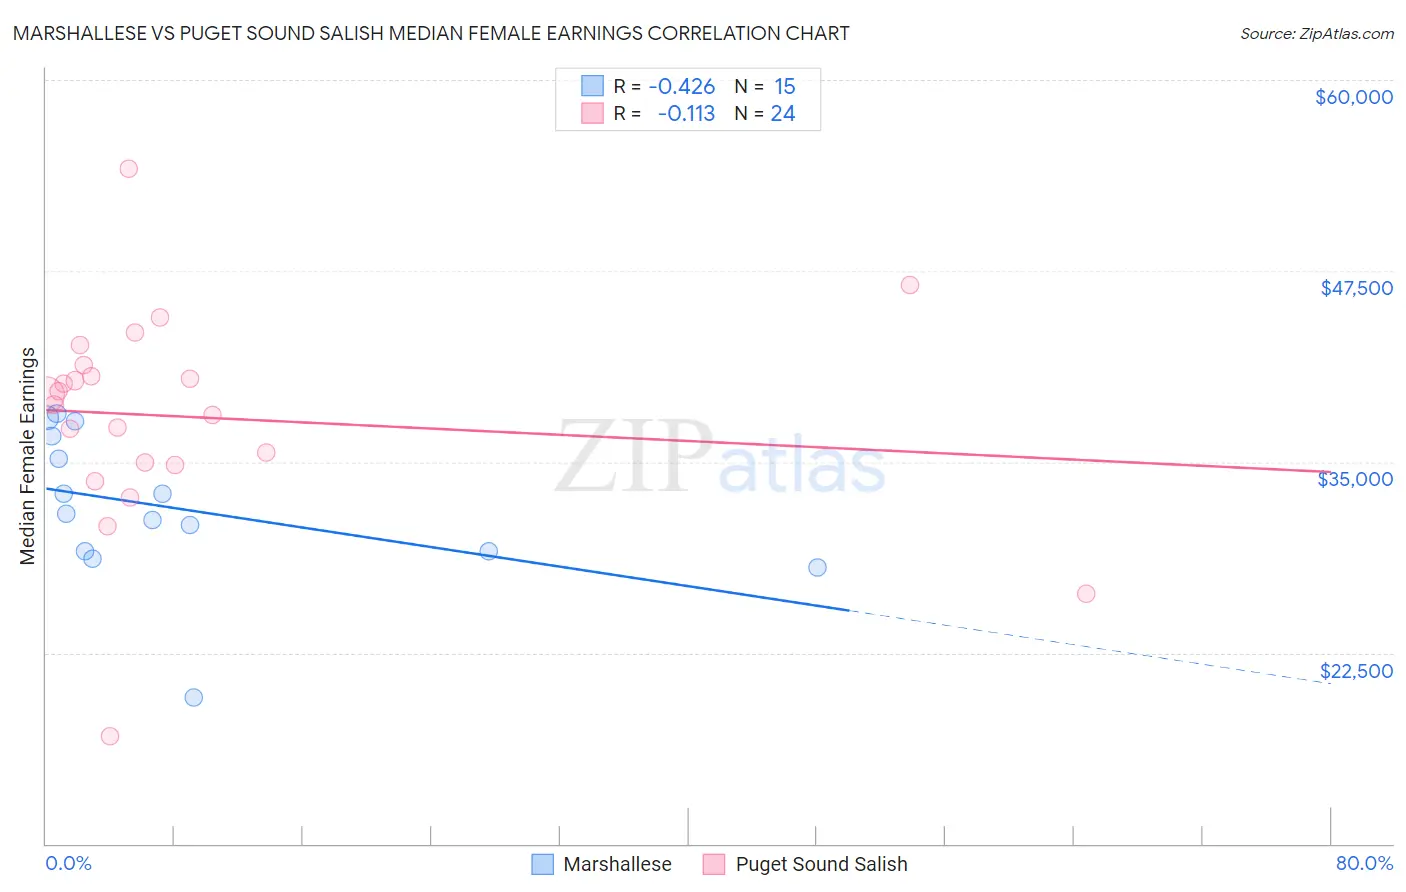
Marshallese vs Puget Sound Salish Median Female Earnings Correlation Chart
The statistical analysis conducted on geographies consisting of 14,760,991 people shows a moderate negative correlation between the proportion of Marshallese and median female earnings in the United States with a correlation coefficient (R) of -0.426 and weighted average of $36,459. Similarly, the statistical analysis conducted on geographies consisting of 46,146,789 people shows a poor negative correlation between the proportion of Puget Sound Salish and median female earnings in the United States with a correlation coefficient (R) of -0.113 and weighted average of $39,376, a difference of 8.0%.
Median Female Earnings Correlation Summary
| Measurement | Marshallese | Puget Sound Salish |
| Minimum | $19,583 | $17,028 |
| Maximum | $38,170 | $54,167 |
| Range | $18,587 | $37,139 |
| Mean | $31,981 | $37,933 |
| Median | $31,627 | $39,067 |
| Interquartile 25% (IQ1) | $29,109 | $34,884 |
| Interquartile 75% (IQ3) | $36,675 | $40,976 |
| Interquartile Range (IQR) | $7,566 | $6,092 |
| Standard Deviation (Sample) | $4,908 | $7,122 |
| Standard Deviation (Population) | $4,742 | $6,972 |
Similar Demographics by Median Female Earnings
Demographics Similar to Marshallese by Median Female Earnings
In terms of median female earnings, the demographic groups most similar to Marshallese are Central American ($36,492, a difference of 0.090%), U.S. Virgin Islander ($36,424, a difference of 0.10%), Immigrants from Caribbean ($36,414, a difference of 0.12%), Iroquois ($36,408, a difference of 0.14%), and African ($36,530, a difference of 0.19%).
| Demographics | Rating | Rank | Median Female Earnings |
| French American Indians | 0.3 /100 | #270 | Tragic $36,920 |
| Nicaraguans | 0.3 /100 | #271 | Tragic $36,904 |
| Immigrants | Dominican Republic | 0.3 /100 | #272 | Tragic $36,857 |
| Immigrants | Laos | 0.3 /100 | #273 | Tragic $36,841 |
| Immigrants | El Salvador | 0.2 /100 | #274 | Tragic $36,673 |
| Africans | 0.1 /100 | #275 | Tragic $36,530 |
| Central Americans | 0.1 /100 | #276 | Tragic $36,492 |
| Marshallese | 0.1 /100 | #277 | Tragic $36,459 |
| U.S. Virgin Islanders | 0.1 /100 | #278 | Tragic $36,424 |
| Immigrants | Caribbean | 0.1 /100 | #279 | Tragic $36,414 |
| Iroquois | 0.1 /100 | #280 | Tragic $36,408 |
| Spanish Americans | 0.1 /100 | #281 | Tragic $36,391 |
| Haitians | 0.1 /100 | #282 | Tragic $36,374 |
| Immigrants | Haiti | 0.1 /100 | #283 | Tragic $36,203 |
| Indonesians | 0.1 /100 | #284 | Tragic $36,140 |
Demographics Similar to Puget Sound Salish by Median Female Earnings
In terms of median female earnings, the demographic groups most similar to Puget Sound Salish are Senegalese ($39,384, a difference of 0.020%), Immigrants from Western Africa ($39,351, a difference of 0.060%), Swedish ($39,421, a difference of 0.11%), Bermudan ($39,418, a difference of 0.11%), and Immigrants ($39,328, a difference of 0.12%).
| Demographics | Rating | Rank | Median Female Earnings |
| Hungarians | 40.3 /100 | #183 | Average $39,510 |
| Europeans | 37.7 /100 | #184 | Fair $39,457 |
| Immigrants | West Indies | 36.9 /100 | #185 | Fair $39,441 |
| Colombians | 36.9 /100 | #186 | Fair $39,439 |
| Swedes | 36.0 /100 | #187 | Fair $39,421 |
| Bermudans | 35.9 /100 | #188 | Fair $39,418 |
| Senegalese | 34.2 /100 | #189 | Fair $39,384 |
| Puget Sound Salish | 33.9 /100 | #190 | Fair $39,376 |
| Immigrants | Western Africa | 32.7 /100 | #191 | Fair $39,351 |
| Immigrants | Immigrants | 31.7 /100 | #192 | Fair $39,328 |
| Immigrants | Nigeria | 30.2 /100 | #193 | Fair $39,294 |
| Irish | 30.0 /100 | #194 | Fair $39,291 |
| Uruguayans | 27.3 /100 | #195 | Fair $39,228 |
| Immigrants | Costa Rica | 25.6 /100 | #196 | Fair $39,186 |
| Assyrians/Chaldeans/Syriacs | 24.6 /100 | #197 | Fair $39,159 |