Maltese vs Scottish Doctorate Degree
COMPARE
Maltese
Scottish
Doctorate Degree
Doctorate Degree Comparison
Maltese
Scottish
2.1%
DOCTORATE DEGREE
96.2/ 100
METRIC RATING
116th/ 347
METRIC RANK
2.0%
DOCTORATE DEGREE
89.4/ 100
METRIC RATING
132nd/ 347
METRIC RANK
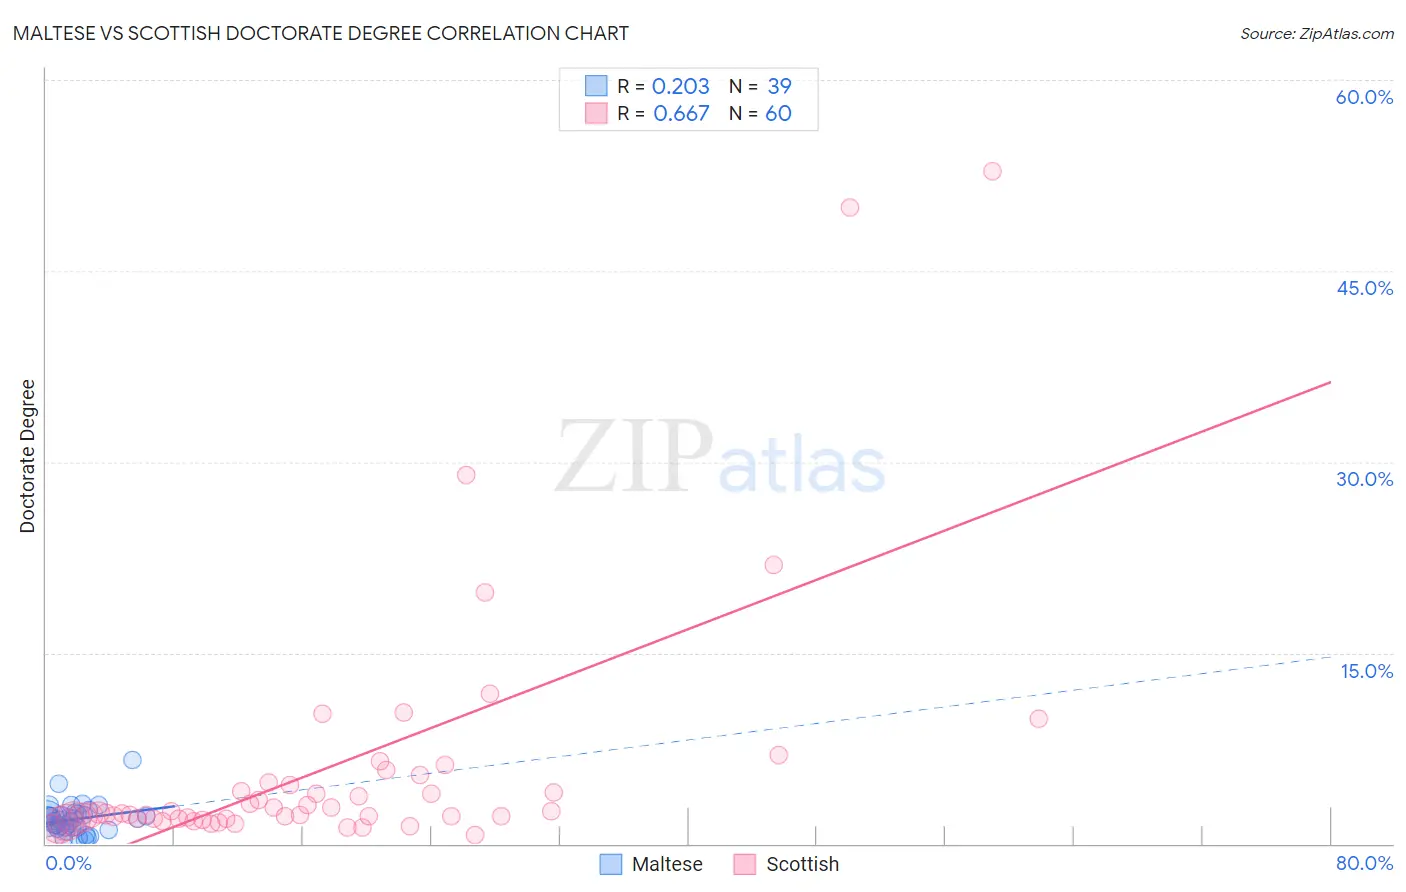
Maltese vs Scottish Doctorate Degree Correlation Chart
The statistical analysis conducted on geographies consisting of 126,152,817 people shows a weak positive correlation between the proportion of Maltese and percentage of population with at least doctorate degree education in the United States with a correlation coefficient (R) of 0.203 and weighted average of 2.1%. Similarly, the statistical analysis conducted on geographies consisting of 542,697,657 people shows a significant positive correlation between the proportion of Scottish and percentage of population with at least doctorate degree education in the United States with a correlation coefficient (R) of 0.667 and weighted average of 2.0%, a difference of 3.7%.
Doctorate Degree Correlation Summary
| Measurement | Maltese | Scottish |
| Minimum | 0.25% | 0.73% |
| Maximum | 6.6% | 52.8% |
| Range | 6.4% | 52.1% |
| Mean | 1.9% | 5.9% |
| Median | 1.9% | 2.4% |
| Interquartile 25% (IQ1) | 1.2% | 2.0% |
| Interquartile 75% (IQ3) | 2.3% | 4.7% |
| Interquartile Range (IQR) | 1.1% | 2.7% |
| Standard Deviation (Sample) | 1.2% | 9.9% |
| Standard Deviation (Population) | 1.2% | 9.9% |
Demographics Similar to Maltese and Scottish by Doctorate Degree
In terms of doctorate degree, the demographic groups most similar to Maltese are Lebanese (2.1%, a difference of 0.17%), Icelander (2.1%, a difference of 0.21%), Pakistani (2.0%, a difference of 0.34%), Taiwanese (2.1%, a difference of 0.46%), and Immigrants from Croatia (2.1%, a difference of 0.54%). Similarly, the demographic groups most similar to Scottish are Immigrants from Uzbekistan (2.0%, a difference of 0.050%), Immigrants from Cameroon (2.0%, a difference of 0.20%), Immigrants from Sierra Leone (2.0%, a difference of 0.28%), Immigrants from Ukraine (2.0%, a difference of 0.41%), and Canadian (2.0%, a difference of 0.42%).
| Demographics | Rating | Rank | Doctorate Degree |
| Immigrants | Croatia | 96.8 /100 | #114 | Exceptional 2.1% |
| Taiwanese | 96.7 /100 | #115 | Exceptional 2.1% |
| Maltese | 96.2 /100 | #116 | Exceptional 2.1% |
| Lebanese | 96.0 /100 | #117 | Exceptional 2.1% |
| Icelanders | 96.0 /100 | #118 | Exceptional 2.1% |
| Pakistanis | 95.8 /100 | #119 | Exceptional 2.0% |
| Immigrants | Morocco | 95.5 /100 | #120 | Exceptional 2.0% |
| Immigrants | Jordan | 94.8 /100 | #121 | Exceptional 2.0% |
| Immigrants | Southern Europe | 94.7 /100 | #122 | Exceptional 2.0% |
| Croatians | 94.0 /100 | #123 | Exceptional 2.0% |
| Ute | 93.2 /100 | #124 | Exceptional 2.0% |
| Moroccans | 93.0 /100 | #125 | Exceptional 2.0% |
| Jordanians | 92.1 /100 | #126 | Exceptional 2.0% |
| Palestinians | 92.0 /100 | #127 | Exceptional 2.0% |
| Immigrants | Zaire | 91.1 /100 | #128 | Exceptional 2.0% |
| Canadians | 90.6 /100 | #129 | Exceptional 2.0% |
| Immigrants | Ukraine | 90.5 /100 | #130 | Exceptional 2.0% |
| Immigrants | Sierra Leone | 90.2 /100 | #131 | Exceptional 2.0% |
| Scottish | 89.4 /100 | #132 | Excellent 2.0% |
| Immigrants | Uzbekistan | 89.3 /100 | #133 | Excellent 2.0% |
| Immigrants | Cameroon | 88.9 /100 | #134 | Excellent 2.0% |