Maltese vs Seminole Per Capita Income
COMPARE
Maltese
Seminole
Per Capita Income
Per Capita Income Comparison
Maltese
Seminole
$49,640
PER CAPITA INCOME
99.9/ 100
METRIC RATING
63rd/ 347
METRIC RANK
$36,180
PER CAPITA INCOME
0.0/ 100
METRIC RATING
314th/ 347
METRIC RANK
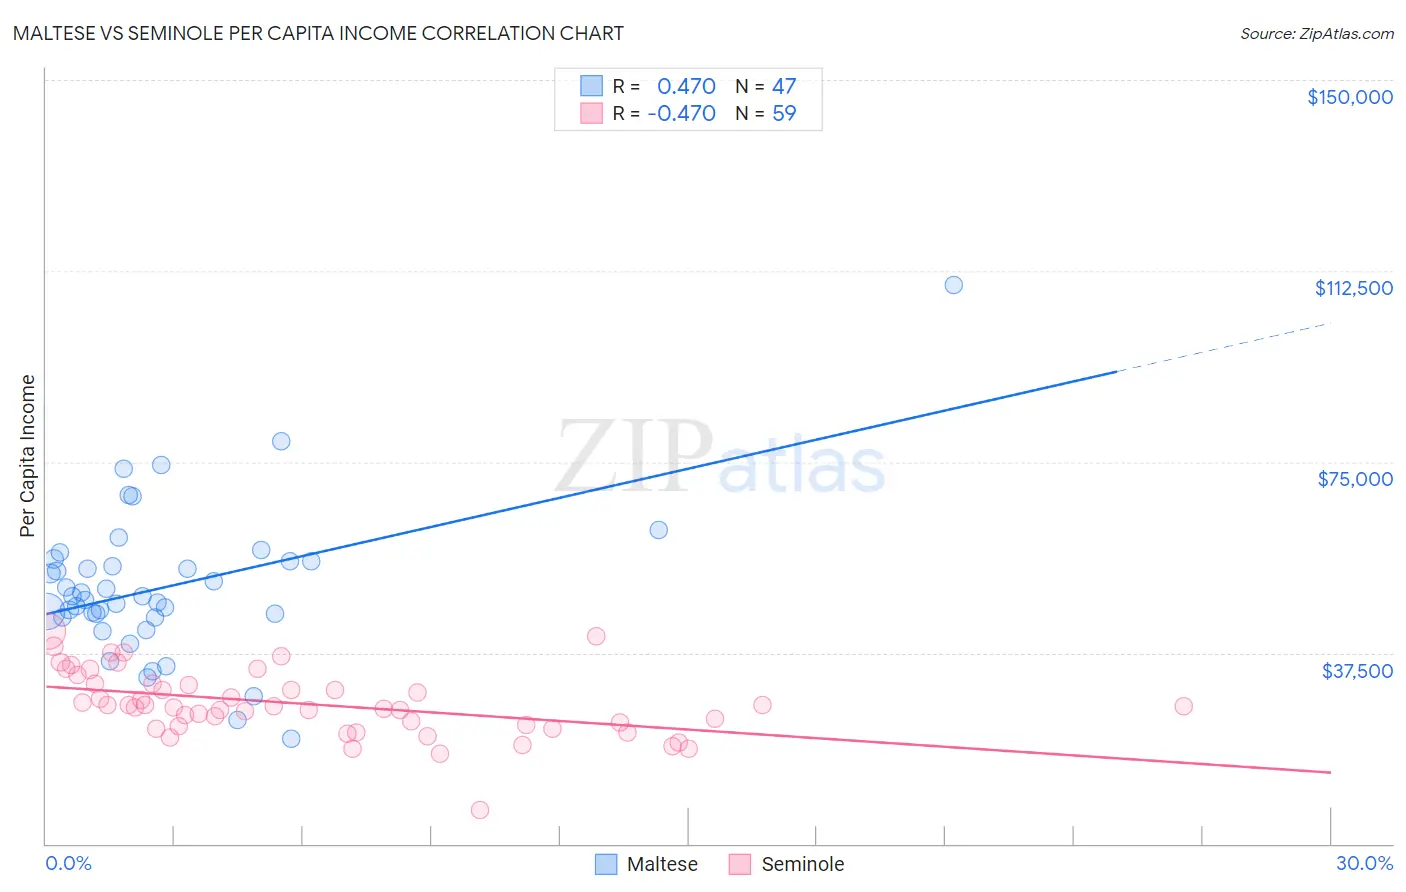
Maltese vs Seminole Per Capita Income Correlation Chart
The statistical analysis conducted on geographies consisting of 126,316,532 people shows a moderate positive correlation between the proportion of Maltese and per capita income in the United States with a correlation coefficient (R) of 0.470 and weighted average of $49,640. Similarly, the statistical analysis conducted on geographies consisting of 118,313,864 people shows a moderate negative correlation between the proportion of Seminole and per capita income in the United States with a correlation coefficient (R) of -0.470 and weighted average of $36,180, a difference of 37.2%.
Per Capita Income Correlation Summary
| Measurement | Maltese | Seminole |
| Minimum | $20,612 | $6,596 |
| Maximum | $109,686 | $41,755 |
| Range | $89,074 | $35,159 |
| Mean | $50,567 | $27,427 |
| Median | $48,495 | $26,891 |
| Interquartile 25% (IQ1) | $44,523 | $23,175 |
| Interquartile 75% (IQ3) | $55,569 | $31,374 |
| Interquartile Range (IQR) | $11,046 | $8,199 |
| Standard Deviation (Sample) | $14,877 | $6,480 |
| Standard Deviation (Population) | $14,718 | $6,425 |
Similar Demographics by Per Capita Income
Demographics Similar to Maltese by Per Capita Income
In terms of per capita income, the demographic groups most similar to Maltese are Immigrants from Argentina ($49,627, a difference of 0.030%), Immigrants from Asia ($49,741, a difference of 0.20%), Bolivian ($49,526, a difference of 0.23%), Immigrants from Bulgaria ($49,482, a difference of 0.32%), and Immigrants from Romania ($49,463, a difference of 0.36%).
| Demographics | Rating | Rank | Per Capita Income |
| Asians | 99.9 /100 | #56 | Exceptional $50,057 |
| South Africans | 99.9 /100 | #57 | Exceptional $50,044 |
| Immigrants | Malaysia | 99.9 /100 | #58 | Exceptional $49,983 |
| Bhutanese | 99.9 /100 | #59 | Exceptional $49,894 |
| Immigrants | Scotland | 99.9 /100 | #60 | Exceptional $49,893 |
| Argentineans | 99.9 /100 | #61 | Exceptional $49,862 |
| Immigrants | Asia | 99.9 /100 | #62 | Exceptional $49,741 |
| Maltese | 99.9 /100 | #63 | Exceptional $49,640 |
| Immigrants | Argentina | 99.9 /100 | #64 | Exceptional $49,627 |
| Bolivians | 99.9 /100 | #65 | Exceptional $49,526 |
| Immigrants | Bulgaria | 99.9 /100 | #66 | Exceptional $49,482 |
| Immigrants | Romania | 99.9 /100 | #67 | Exceptional $49,463 |
| Lithuanians | 99.8 /100 | #68 | Exceptional $49,448 |
| Immigrants | Canada | 99.8 /100 | #69 | Exceptional $49,412 |
| Immigrants | Eastern Europe | 99.8 /100 | #70 | Exceptional $49,316 |
Demographics Similar to Seminole by Per Capita Income
In terms of per capita income, the demographic groups most similar to Seminole are Yaqui ($36,112, a difference of 0.19%), Choctaw ($35,999, a difference of 0.50%), Bahamian ($36,427, a difference of 0.68%), Dutch West Indian ($35,922, a difference of 0.72%), and Bangladeshi ($35,897, a difference of 0.79%).
| Demographics | Rating | Rank | Per Capita Income |
| Immigrants | Latin America | 0.0 /100 | #307 | Tragic $36,823 |
| Fijians | 0.0 /100 | #308 | Tragic $36,690 |
| Immigrants | Honduras | 0.0 /100 | #309 | Tragic $36,665 |
| Ute | 0.0 /100 | #310 | Tragic $36,651 |
| Chippewa | 0.0 /100 | #311 | Tragic $36,631 |
| Chickasaw | 0.0 /100 | #312 | Tragic $36,475 |
| Bahamians | 0.0 /100 | #313 | Tragic $36,427 |
| Seminole | 0.0 /100 | #314 | Tragic $36,180 |
| Yaqui | 0.0 /100 | #315 | Tragic $36,112 |
| Choctaw | 0.0 /100 | #316 | Tragic $35,999 |
| Dutch West Indians | 0.0 /100 | #317 | Tragic $35,922 |
| Bangladeshis | 0.0 /100 | #318 | Tragic $35,897 |
| Immigrants | Congo | 0.0 /100 | #319 | Tragic $35,720 |
| Hispanics or Latinos | 0.0 /100 | #320 | Tragic $35,688 |
| Blacks/African Americans | 0.0 /100 | #321 | Tragic $35,564 |