Immigrants from Ghana vs Immigrants from West Indies Median Female Earnings
COMPARE
Immigrants from Ghana
Immigrants from West Indies
Median Female Earnings
Median Female Earnings Comparison
Immigrants from Ghana
Immigrants from West Indies
$39,894
MEDIAN FEMALE EARNINGS
60.0/ 100
METRIC RATING
166th/ 347
METRIC RANK
$39,441
MEDIAN FEMALE EARNINGS
36.9/ 100
METRIC RATING
185th/ 347
METRIC RANK
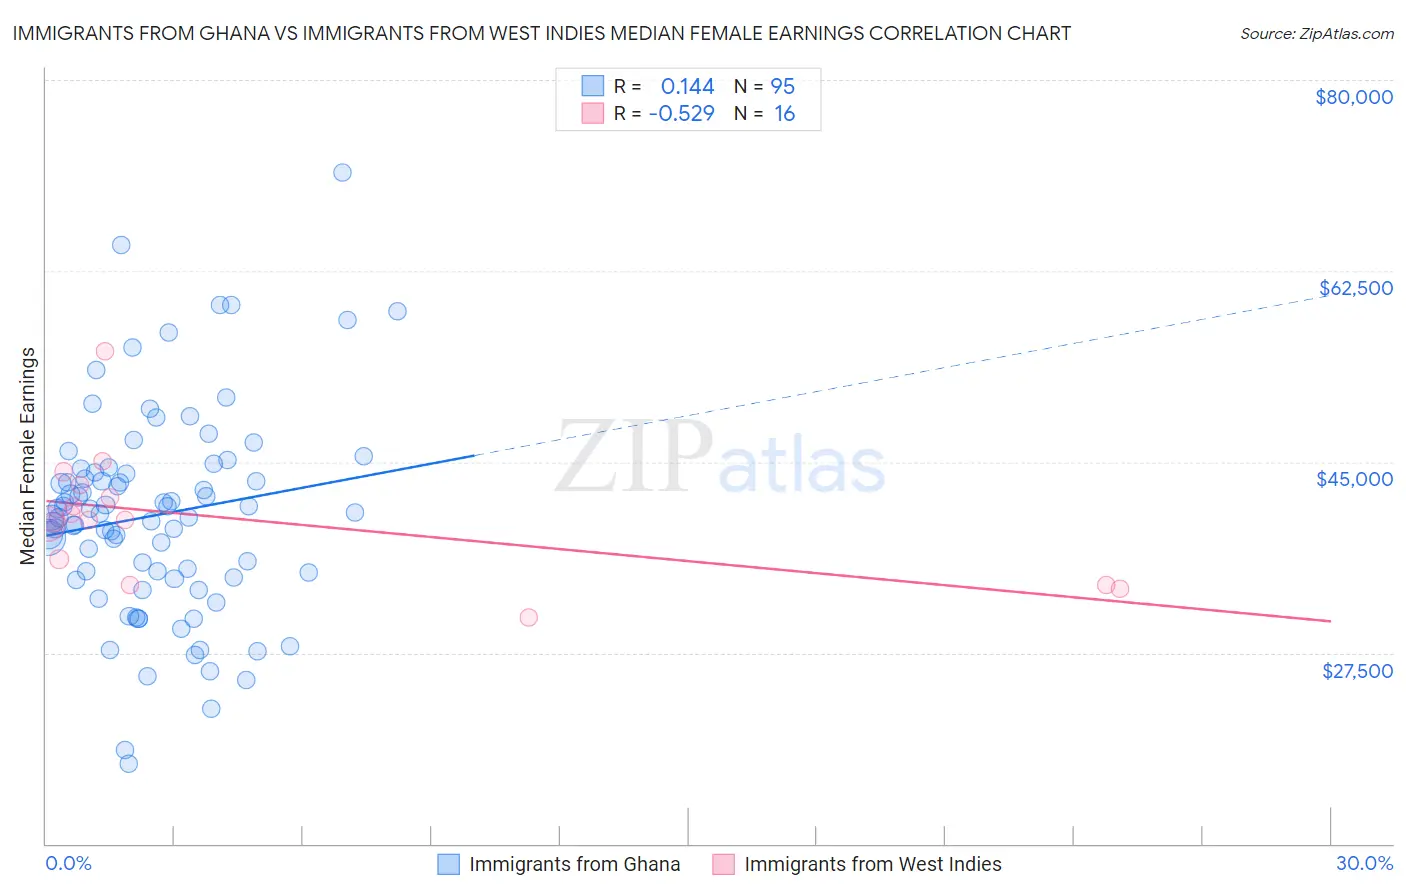
Immigrants from Ghana vs Immigrants from West Indies Median Female Earnings Correlation Chart
The statistical analysis conducted on geographies consisting of 199,948,896 people shows a poor positive correlation between the proportion of Immigrants from Ghana and median female earnings in the United States with a correlation coefficient (R) of 0.144 and weighted average of $39,894. Similarly, the statistical analysis conducted on geographies consisting of 72,414,276 people shows a substantial negative correlation between the proportion of Immigrants from West Indies and median female earnings in the United States with a correlation coefficient (R) of -0.529 and weighted average of $39,441, a difference of 1.1%.
Median Female Earnings Correlation Summary
| Measurement | Immigrants from Ghana | Immigrants from West Indies |
| Minimum | $17,379 | $30,781 |
| Maximum | $71,536 | $55,116 |
| Range | $54,157 | $24,335 |
| Mean | $40,108 | $39,738 |
| Median | $40,246 | $39,670 |
| Interquartile 25% (IQ1) | $34,346 | $34,901 |
| Interquartile 75% (IQ3) | $44,036 | $42,316 |
| Interquartile Range (IQR) | $9,690 | $7,415 |
| Standard Deviation (Sample) | $9,436 | $5,811 |
| Standard Deviation (Population) | $9,386 | $5,627 |
Demographics Similar to Immigrants from Ghana and Immigrants from West Indies by Median Female Earnings
In terms of median female earnings, the demographic groups most similar to Immigrants from Ghana are Luxembourger ($39,891, a difference of 0.010%), Immigrants from Bangladesh ($39,910, a difference of 0.040%), Immigrants from Peru ($39,871, a difference of 0.060%), Kenyan ($39,860, a difference of 0.080%), and Slovene ($39,817, a difference of 0.19%). Similarly, the demographic groups most similar to Immigrants from West Indies are European ($39,457, a difference of 0.040%), Tlingit-Haida ($39,513, a difference of 0.18%), Hungarian ($39,510, a difference of 0.18%), Tsimshian ($39,530, a difference of 0.23%), and Immigrants from Kenya ($39,535, a difference of 0.24%).
| Demographics | Rating | Rank | Median Female Earnings |
| Immigrants | Bangladesh | 60.8 /100 | #165 | Good $39,910 |
| Immigrants | Ghana | 60.0 /100 | #166 | Good $39,894 |
| Luxembourgers | 59.9 /100 | #167 | Average $39,891 |
| Immigrants | Peru | 58.9 /100 | #168 | Average $39,871 |
| Kenyans | 58.4 /100 | #169 | Average $39,860 |
| Slovenes | 56.2 /100 | #170 | Average $39,817 |
| Immigrants | Portugal | 54.7 /100 | #171 | Average $39,788 |
| British | 53.8 /100 | #172 | Average $39,772 |
| Canadians | 51.4 /100 | #173 | Average $39,724 |
| South Americans | 50.0 /100 | #174 | Average $39,698 |
| Immigrants | South America | 47.2 /100 | #175 | Average $39,643 |
| Nigerians | 47.0 /100 | #176 | Average $39,641 |
| Costa Ricans | 46.1 /100 | #177 | Average $39,622 |
| Slavs | 45.6 /100 | #178 | Average $39,613 |
| Immigrants | Germany | 45.1 /100 | #179 | Average $39,603 |
| Immigrants | Kenya | 41.6 /100 | #180 | Average $39,535 |
| Tsimshian | 41.4 /100 | #181 | Average $39,530 |
| Tlingit-Haida | 40.5 /100 | #182 | Average $39,513 |
| Hungarians | 40.3 /100 | #183 | Average $39,510 |
| Europeans | 37.7 /100 | #184 | Fair $39,457 |
| Immigrants | West Indies | 36.9 /100 | #185 | Fair $39,441 |