Macedonian vs Immigrants from Kuwait Hearing Disability
COMPARE
Macedonian
Immigrants from Kuwait
Hearing Disability
Hearing Disability Comparison
Macedonians
Immigrants from Kuwait
3.1%
HEARING DISABILITY
27.0/ 100
METRIC RATING
193rd/ 347
METRIC RANK
2.8%
HEARING DISABILITY
96.3/ 100
METRIC RATING
93rd/ 347
METRIC RANK
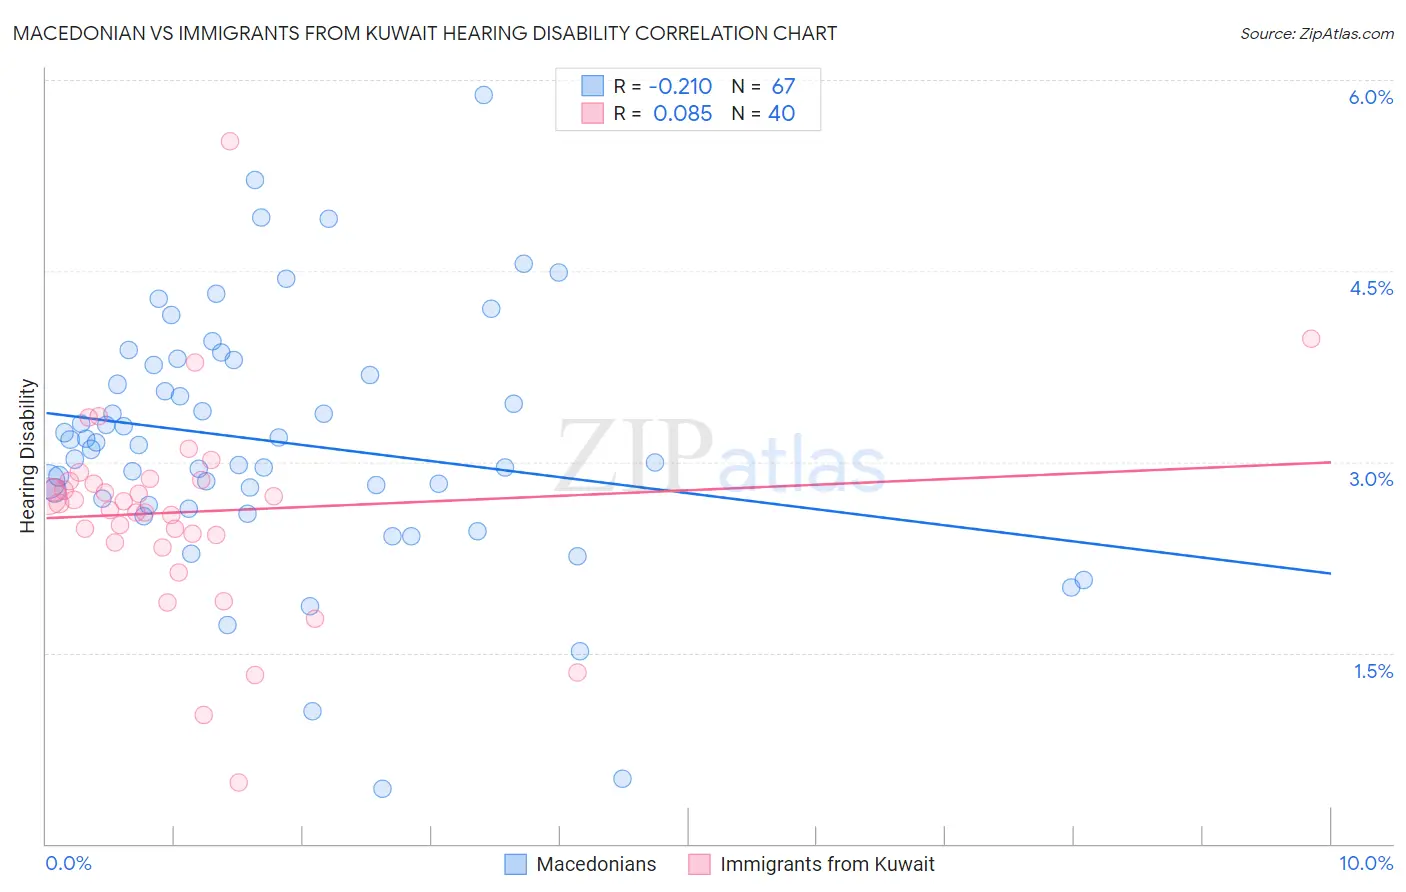
Macedonian vs Immigrants from Kuwait Hearing Disability Correlation Chart
The statistical analysis conducted on geographies consisting of 132,651,102 people shows a weak negative correlation between the proportion of Macedonians and percentage of population with hearing disability in the United States with a correlation coefficient (R) of -0.210 and weighted average of 3.1%. Similarly, the statistical analysis conducted on geographies consisting of 136,905,623 people shows a slight positive correlation between the proportion of Immigrants from Kuwait and percentage of population with hearing disability in the United States with a correlation coefficient (R) of 0.085 and weighted average of 2.8%, a difference of 10.8%.
Hearing Disability Correlation Summary
| Measurement | Macedonian | Immigrants from Kuwait |
| Minimum | 0.44% | 0.48% |
| Maximum | 5.9% | 5.5% |
| Range | 5.4% | 5.0% |
| Mean | 3.2% | 2.6% |
| Median | 3.1% | 2.7% |
| Interquartile 25% (IQ1) | 2.7% | 2.4% |
| Interquartile 75% (IQ3) | 3.8% | 2.9% |
| Interquartile Range (IQR) | 1.1% | 0.46% |
| Standard Deviation (Sample) | 0.99% | 0.82% |
| Standard Deviation (Population) | 0.99% | 0.81% |
Similar Demographics by Hearing Disability
Demographics Similar to Macedonians by Hearing Disability
In terms of hearing disability, the demographic groups most similar to Macedonians are Korean (3.1%, a difference of 0.080%), Immigrants from Switzerland (3.1%, a difference of 0.21%), South African (3.1%, a difference of 0.30%), Spanish American Indian (3.1%, a difference of 0.35%), and Immigrants from South Africa (3.1%, a difference of 0.46%).
| Demographics | Rating | Rank | Hearing Disability |
| Immigrants | Mexico | 34.9 /100 | #186 | Fair 3.0% |
| Blacks/African Americans | 34.7 /100 | #187 | Fair 3.0% |
| Mexican American Indians | 34.7 /100 | #188 | Fair 3.0% |
| Africans | 32.9 /100 | #189 | Fair 3.0% |
| Immigrants | South Africa | 31.1 /100 | #190 | Fair 3.1% |
| Immigrants | Switzerland | 28.8 /100 | #191 | Fair 3.1% |
| Koreans | 27.6 /100 | #192 | Fair 3.1% |
| Macedonians | 27.0 /100 | #193 | Fair 3.1% |
| South Africans | 24.5 /100 | #194 | Fair 3.1% |
| Spanish American Indians | 24.1 /100 | #195 | Fair 3.1% |
| Immigrants | Europe | 22.9 /100 | #196 | Fair 3.1% |
| Immigrants | Bosnia and Herzegovina | 20.6 /100 | #197 | Fair 3.1% |
| Immigrants | Croatia | 20.5 /100 | #198 | Fair 3.1% |
| Syrians | 19.2 /100 | #199 | Poor 3.1% |
| Immigrants | North Macedonia | 19.1 /100 | #200 | Poor 3.1% |
Demographics Similar to Immigrants from Kuwait by Hearing Disability
In terms of hearing disability, the demographic groups most similar to Immigrants from Kuwait are Iranian (2.8%, a difference of 0.12%), Immigrants from Middle Africa (2.8%, a difference of 0.15%), Immigrants from Morocco (2.8%, a difference of 0.23%), Belizean (2.8%, a difference of 0.26%), and Uruguayan (2.8%, a difference of 0.27%).
| Demographics | Rating | Rank | Hearing Disability |
| Immigrants | Iran | 96.8 /100 | #86 | Exceptional 2.8% |
| Somalis | 96.7 /100 | #87 | Exceptional 2.8% |
| Immigrants | Turkey | 96.7 /100 | #88 | Exceptional 2.8% |
| Belizeans | 96.6 /100 | #89 | Exceptional 2.8% |
| Immigrants | Morocco | 96.6 /100 | #90 | Exceptional 2.8% |
| Immigrants | Middle Africa | 96.5 /100 | #91 | Exceptional 2.8% |
| Iranians | 96.4 /100 | #92 | Exceptional 2.8% |
| Immigrants | Kuwait | 96.3 /100 | #93 | Exceptional 2.8% |
| Uruguayans | 95.9 /100 | #94 | Exceptional 2.8% |
| Israelis | 95.9 /100 | #95 | Exceptional 2.8% |
| Immigrants | Somalia | 95.5 /100 | #96 | Exceptional 2.8% |
| Immigrants | Afghanistan | 95.3 /100 | #97 | Exceptional 2.8% |
| Immigrants | Honduras | 95.1 /100 | #98 | Exceptional 2.8% |
| Immigrants | Guatemala | 95.1 /100 | #99 | Exceptional 2.8% |
| Immigrants | Eastern Africa | 95.0 /100 | #100 | Exceptional 2.8% |