Immigrants from Ethiopia vs Immigrants from Congo Median Family Income
COMPARE
Immigrants from Ethiopia
Immigrants from Congo
Median Family Income
Median Family Income Comparison
Immigrants from Ethiopia
Immigrants from Congo
$106,969
MEDIAN FAMILY INCOME
90.0/ 100
METRIC RATING
128th/ 347
METRIC RANK
$82,216
MEDIAN FAMILY INCOME
0.0/ 100
METRIC RATING
326th/ 347
METRIC RANK
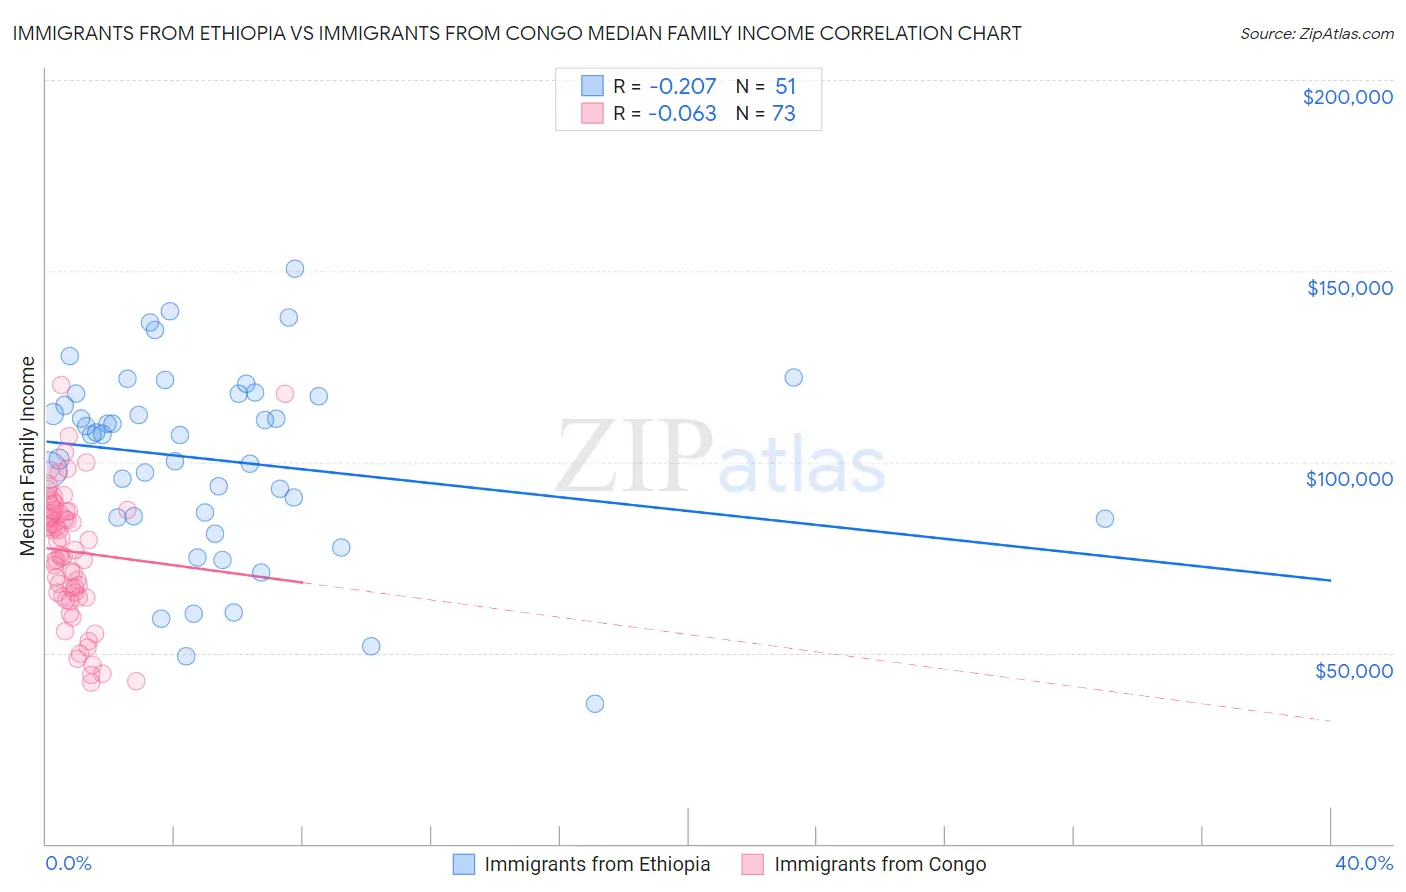
Immigrants from Ethiopia vs Immigrants from Congo Median Family Income Correlation Chart
The statistical analysis conducted on geographies consisting of 211,422,914 people shows a weak negative correlation between the proportion of Immigrants from Ethiopia and median family income in the United States with a correlation coefficient (R) of -0.207 and weighted average of $106,969. Similarly, the statistical analysis conducted on geographies consisting of 92,050,082 people shows a slight negative correlation between the proportion of Immigrants from Congo and median family income in the United States with a correlation coefficient (R) of -0.063 and weighted average of $82,216, a difference of 30.1%.
Median Family Income Correlation Summary
| Measurement | Immigrants from Ethiopia | Immigrants from Congo |
| Minimum | $36,544 | $42,229 |
| Maximum | $150,528 | $120,257 |
| Range | $113,984 | $78,028 |
| Mean | $100,429 | $76,553 |
| Median | $107,133 | $79,188 |
| Interquartile 25% (IQ1) | $85,358 | $65,174 |
| Interquartile 75% (IQ3) | $117,899 | $87,165 |
| Interquartile Range (IQR) | $32,541 | $21,991 |
| Standard Deviation (Sample) | $24,958 | $17,096 |
| Standard Deviation (Population) | $24,712 | $16,978 |
Similar Demographics by Median Family Income
Demographics Similar to Immigrants from Ethiopia by Median Family Income
In terms of median family income, the demographic groups most similar to Immigrants from Ethiopia are Arab ($106,952, a difference of 0.020%), Brazilian ($106,942, a difference of 0.030%), Lebanese ($107,086, a difference of 0.11%), Serbian ($107,157, a difference of 0.18%), and Taiwanese ($107,295, a difference of 0.30%).
| Demographics | Rating | Rank | Median Family Income |
| Europeans | 94.1 /100 | #121 | Exceptional $108,099 |
| Immigrants | Jordan | 92.9 /100 | #122 | Exceptional $107,715 |
| Carpatho Rusyns | 92.2 /100 | #123 | Exceptional $107,502 |
| Pakistanis | 91.7 /100 | #124 | Exceptional $107,390 |
| Taiwanese | 91.4 /100 | #125 | Exceptional $107,295 |
| Serbians | 90.8 /100 | #126 | Exceptional $107,157 |
| Lebanese | 90.5 /100 | #127 | Exceptional $107,086 |
| Immigrants | Ethiopia | 90.0 /100 | #128 | Excellent $106,969 |
| Arabs | 89.9 /100 | #129 | Excellent $106,952 |
| Brazilians | 89.8 /100 | #130 | Excellent $106,942 |
| Canadians | 88.1 /100 | #131 | Excellent $106,597 |
| Immigrants | Fiji | 87.8 /100 | #132 | Excellent $106,544 |
| Ugandans | 87.8 /100 | #133 | Excellent $106,541 |
| Immigrants | Oceania | 87.3 /100 | #134 | Excellent $106,453 |
| Portuguese | 86.3 /100 | #135 | Excellent $106,286 |
Demographics Similar to Immigrants from Congo by Median Family Income
In terms of median family income, the demographic groups most similar to Immigrants from Congo are Arapaho ($82,064, a difference of 0.19%), Sioux ($82,386, a difference of 0.21%), Black/African American ($81,912, a difference of 0.37%), Creek ($82,560, a difference of 0.42%), and Dutch West Indian ($81,852, a difference of 0.45%).
| Demographics | Rating | Rank | Median Family Income |
| Immigrants | Honduras | 0.0 /100 | #319 | Tragic $83,618 |
| Seminole | 0.0 /100 | #320 | Tragic $83,354 |
| Immigrants | Caribbean | 0.0 /100 | #321 | Tragic $83,319 |
| Dominicans | 0.0 /100 | #322 | Tragic $82,888 |
| Bahamians | 0.0 /100 | #323 | Tragic $82,631 |
| Creek | 0.0 /100 | #324 | Tragic $82,560 |
| Sioux | 0.0 /100 | #325 | Tragic $82,386 |
| Immigrants | Congo | 0.0 /100 | #326 | Tragic $82,216 |
| Arapaho | 0.0 /100 | #327 | Tragic $82,064 |
| Blacks/African Americans | 0.0 /100 | #328 | Tragic $81,912 |
| Dutch West Indians | 0.0 /100 | #329 | Tragic $81,852 |
| Cheyenne | 0.0 /100 | #330 | Tragic $81,385 |
| Immigrants | Dominican Republic | 0.0 /100 | #331 | Tragic $81,233 |
| Natives/Alaskans | 0.0 /100 | #332 | Tragic $80,908 |
| Kiowa | 0.0 /100 | #333 | Tragic $80,885 |