Macedonian vs Immigrants from Congo Male Unemployment
COMPARE
Macedonian
Immigrants from Congo
Male Unemployment
Male Unemployment Comparison
Macedonians
Immigrants from Congo
5.2%
MALE UNEMPLOYMENT
77.7/ 100
METRIC RATING
145th/ 347
METRIC RANK
5.3%
MALE UNEMPLOYMENT
57.4/ 100
METRIC RATING
169th/ 347
METRIC RANK
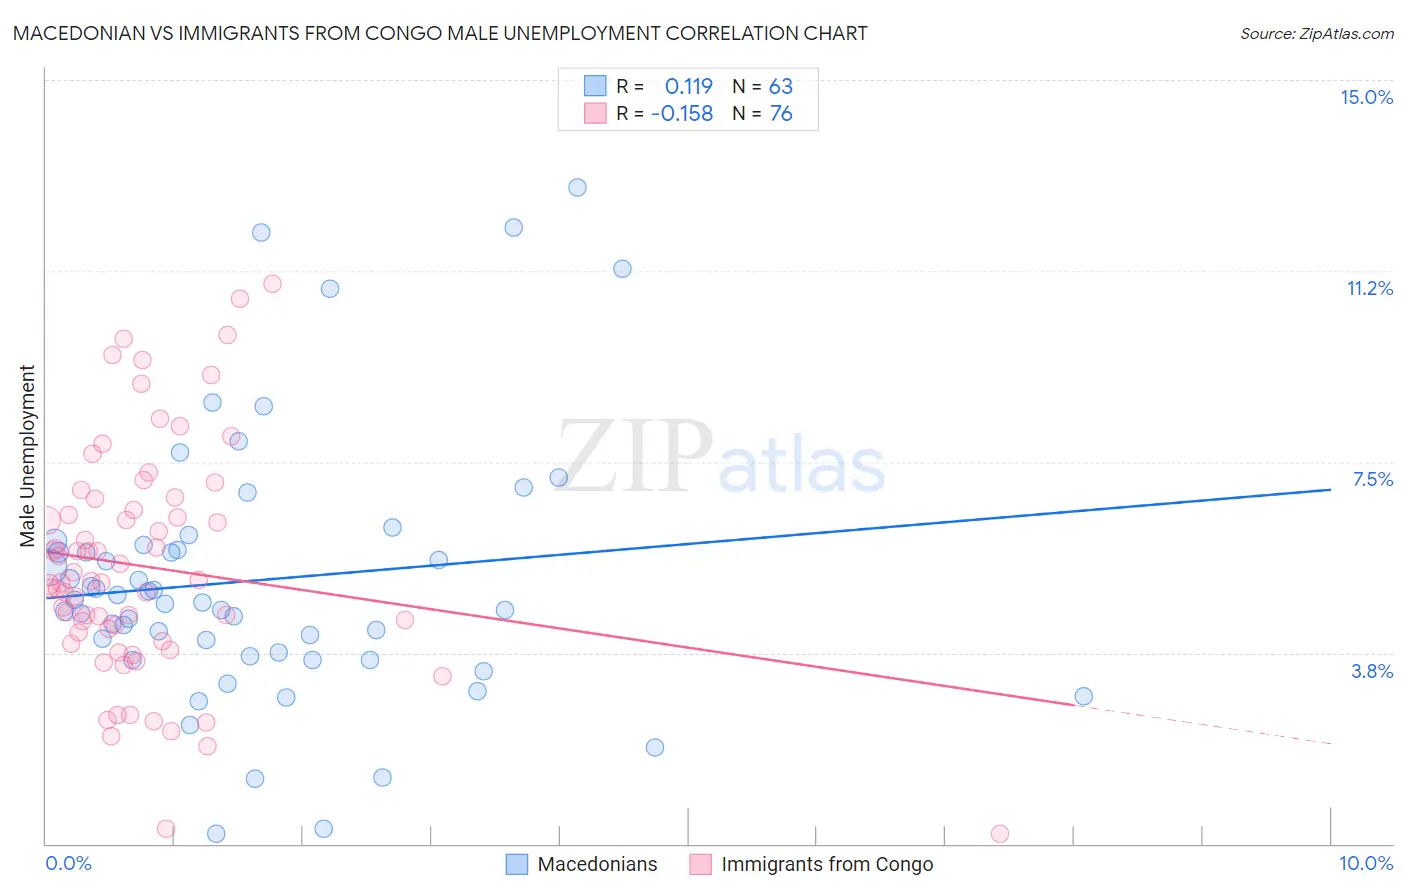
Macedonian vs Immigrants from Congo Male Unemployment Correlation Chart
The statistical analysis conducted on geographies consisting of 132,415,215 people shows a poor positive correlation between the proportion of Macedonians and unemployment rate among males in the United States with a correlation coefficient (R) of 0.119 and weighted average of 5.2%. Similarly, the statistical analysis conducted on geographies consisting of 92,075,250 people shows a poor negative correlation between the proportion of Immigrants from Congo and unemployment rate among males in the United States with a correlation coefficient (R) of -0.158 and weighted average of 5.3%, a difference of 1.4%.
Male Unemployment Correlation Summary
| Measurement | Macedonian | Immigrants from Congo |
| Minimum | 0.20% | 0.20% |
| Maximum | 12.9% | 11.0% |
| Range | 12.7% | 10.8% |
| Mean | 5.2% | 5.4% |
| Median | 4.7% | 5.1% |
| Interquartile 25% (IQ1) | 3.7% | 4.1% |
| Interquartile 75% (IQ3) | 5.9% | 6.7% |
| Interquartile Range (IQR) | 2.2% | 2.6% |
| Standard Deviation (Sample) | 2.6% | 2.3% |
| Standard Deviation (Population) | 2.6% | 2.3% |
Similar Demographics by Male Unemployment
Demographics Similar to Macedonians by Male Unemployment
In terms of male unemployment, the demographic groups most similar to Macedonians are Sri Lankan (5.2%, a difference of 0.010%), Immigrants from Kenya (5.2%, a difference of 0.010%), Syrian (5.2%, a difference of 0.020%), Immigrants from Burma/Myanmar (5.2%, a difference of 0.020%), and Fijian (5.2%, a difference of 0.050%).
| Demographics | Rating | Rank | Male Unemployment |
| Immigrants | Croatia | 79.7 /100 | #138 | Good 5.2% |
| Kenyans | 79.4 /100 | #139 | Good 5.2% |
| Brazilians | 79.3 /100 | #140 | Good 5.2% |
| Immigrants | Switzerland | 79.2 /100 | #141 | Good 5.2% |
| Fijians | 78.3 /100 | #142 | Good 5.2% |
| Syrians | 78.0 /100 | #143 | Good 5.2% |
| Sri Lankans | 77.9 /100 | #144 | Good 5.2% |
| Macedonians | 77.7 /100 | #145 | Good 5.2% |
| Immigrants | Kenya | 77.6 /100 | #146 | Good 5.2% |
| Immigrants | Burma/Myanmar | 77.5 /100 | #147 | Good 5.2% |
| Immigrants | Italy | 76.3 /100 | #148 | Good 5.2% |
| Immigrants | Europe | 76.2 /100 | #149 | Good 5.2% |
| Indians (Asian) | 76.0 /100 | #150 | Good 5.2% |
| Slovaks | 75.5 /100 | #151 | Good 5.2% |
| Egyptians | 74.8 /100 | #152 | Good 5.2% |
Demographics Similar to Immigrants from Congo by Male Unemployment
In terms of male unemployment, the demographic groups most similar to Immigrants from Congo are Immigrants from Ireland (5.3%, a difference of 0.020%), Immigrants from Vietnam (5.3%, a difference of 0.040%), Immigrants from Morocco (5.3%, a difference of 0.17%), South American (5.3%, a difference of 0.20%), and Immigrants from Eastern Europe (5.3%, a difference of 0.20%).
| Demographics | Rating | Rank | Male Unemployment |
| Immigrants | Egypt | 65.9 /100 | #162 | Good 5.2% |
| Immigrants | Hong Kong | 65.7 /100 | #163 | Good 5.2% |
| Afghans | 62.0 /100 | #164 | Good 5.3% |
| South Americans | 60.6 /100 | #165 | Good 5.3% |
| Immigrants | Morocco | 60.2 /100 | #166 | Good 5.3% |
| Immigrants | Vietnam | 58.1 /100 | #167 | Average 5.3% |
| Immigrants | Ireland | 57.7 /100 | #168 | Average 5.3% |
| Immigrants | Congo | 57.4 /100 | #169 | Average 5.3% |
| Immigrants | Eastern Europe | 54.1 /100 | #170 | Average 5.3% |
| Peruvians | 51.9 /100 | #171 | Average 5.3% |
| Immigrants | Kazakhstan | 50.8 /100 | #172 | Average 5.3% |
| Immigrants | Russia | 50.7 /100 | #173 | Average 5.3% |
| Immigrants | Iran | 50.0 /100 | #174 | Average 5.3% |
| Immigrants | Iraq | 48.1 /100 | #175 | Average 5.3% |
| Immigrants | Poland | 46.0 /100 | #176 | Average 5.3% |