Burmese vs Cypriot Median Family Income
COMPARE
Burmese
Cypriot
Median Family Income
Median Family Income Comparison
Burmese
Cypriots
$123,369
MEDIAN FAMILY INCOME
100.0/ 100
METRIC RATING
20th/ 347
METRIC RANK
$127,064
MEDIAN FAMILY INCOME
100.0/ 100
METRIC RATING
12th/ 347
METRIC RANK
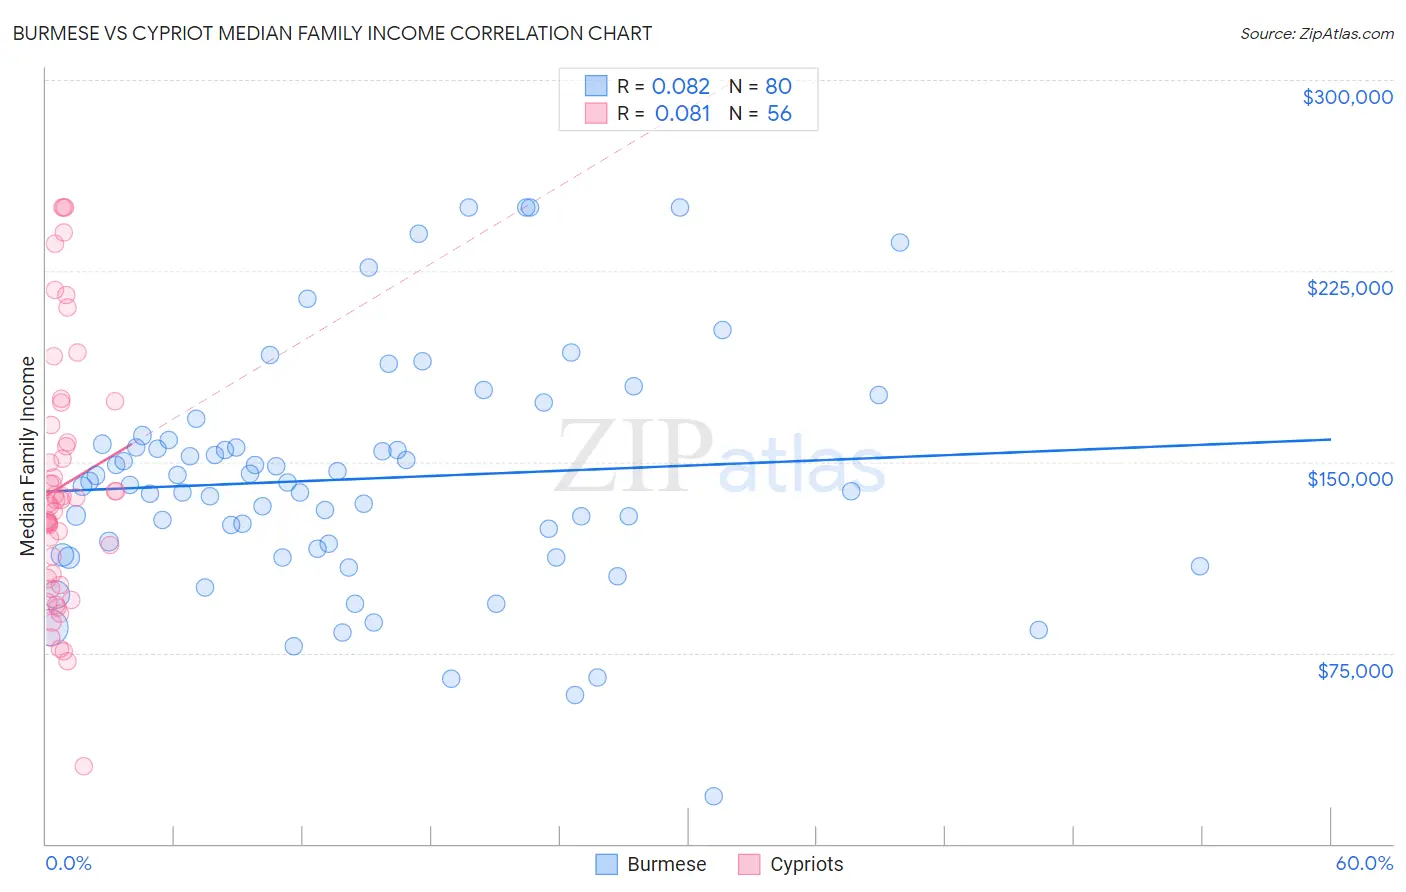
Burmese vs Cypriot Median Family Income Correlation Chart
The statistical analysis conducted on geographies consisting of 464,661,736 people shows a slight positive correlation between the proportion of Burmese and median family income in the United States with a correlation coefficient (R) of 0.082 and weighted average of $123,369. Similarly, the statistical analysis conducted on geographies consisting of 61,838,668 people shows a slight positive correlation between the proportion of Cypriots and median family income in the United States with a correlation coefficient (R) of 0.081 and weighted average of $127,064, a difference of 3.0%.
Median Family Income Correlation Summary
| Measurement | Burmese | Cypriot |
| Minimum | $18,796 | $30,441 |
| Maximum | $250,001 | $250,001 |
| Range | $231,205 | $219,560 |
| Mean | $143,360 | $140,451 |
| Median | $141,361 | $134,246 |
| Interquartile 25% (IQ1) | $114,595 | $104,944 |
| Interquartile 75% (IQ3) | $157,872 | $161,047 |
| Interquartile Range (IQR) | $43,276 | $56,103 |
| Standard Deviation (Sample) | $46,200 | $49,252 |
| Standard Deviation (Population) | $45,911 | $48,811 |
Demographics Similar to Burmese and Cypriots by Median Family Income
In terms of median family income, the demographic groups most similar to Burmese are Immigrants from Belgium ($123,831, a difference of 0.37%), Immigrants from Korea ($122,800, a difference of 0.46%), Immigrants from Sweden ($122,765, a difference of 0.49%), Immigrants from Japan ($122,764, a difference of 0.49%), and Immigrants from Northern Europe ($121,840, a difference of 1.3%). Similarly, the demographic groups most similar to Cypriots are Immigrants from Israel ($127,430, a difference of 0.29%), Immigrants from Australia ($126,620, a difference of 0.35%), Immigrants from Ireland ($127,584, a difference of 0.41%), Immigrants from South Central Asia ($125,956, a difference of 0.88%), and Eastern European ($125,546, a difference of 1.2%).
| Demographics | Rating | Rank | Median Family Income |
| Thais | 100.0 /100 | #6 | Exceptional $131,281 |
| Immigrants | Hong Kong | 100.0 /100 | #7 | Exceptional $131,067 |
| Immigrants | Iran | 100.0 /100 | #8 | Exceptional $130,894 |
| Okinawans | 100.0 /100 | #9 | Exceptional $129,979 |
| Immigrants | Ireland | 100.0 /100 | #10 | Exceptional $127,584 |
| Immigrants | Israel | 100.0 /100 | #11 | Exceptional $127,430 |
| Cypriots | 100.0 /100 | #12 | Exceptional $127,064 |
| Immigrants | Australia | 100.0 /100 | #13 | Exceptional $126,620 |
| Immigrants | South Central Asia | 100.0 /100 | #14 | Exceptional $125,956 |
| Eastern Europeans | 100.0 /100 | #15 | Exceptional $125,546 |
| Immigrants | China | 100.0 /100 | #16 | Exceptional $125,540 |
| Indians (Asian) | 100.0 /100 | #17 | Exceptional $125,312 |
| Immigrants | Eastern Asia | 100.0 /100 | #18 | Exceptional $125,150 |
| Immigrants | Belgium | 100.0 /100 | #19 | Exceptional $123,831 |
| Burmese | 100.0 /100 | #20 | Exceptional $123,369 |
| Immigrants | Korea | 100.0 /100 | #21 | Exceptional $122,800 |
| Immigrants | Sweden | 100.0 /100 | #22 | Exceptional $122,765 |
| Immigrants | Japan | 100.0 /100 | #23 | Exceptional $122,764 |
| Immigrants | Northern Europe | 100.0 /100 | #24 | Exceptional $121,840 |
| Turks | 100.0 /100 | #25 | Exceptional $121,202 |
| Immigrants | Switzerland | 100.0 /100 | #26 | Exceptional $120,726 |