Luxembourger vs Alsatian Female Poverty Among 25-34 Year Olds
COMPARE
Luxembourger
Alsatian
Female Poverty Among 25-34 Year Olds
Female Poverty Among 25-34 Year Olds Comparison
Luxembourgers
Alsatians
12.1%
FEMALE POVERTY AMONG 25-34 YEAR OLDS
99.5/ 100
METRIC RATING
56th/ 347
METRIC RANK
14.7%
FEMALE POVERTY AMONG 25-34 YEAR OLDS
1.4/ 100
METRIC RATING
238th/ 347
METRIC RANK
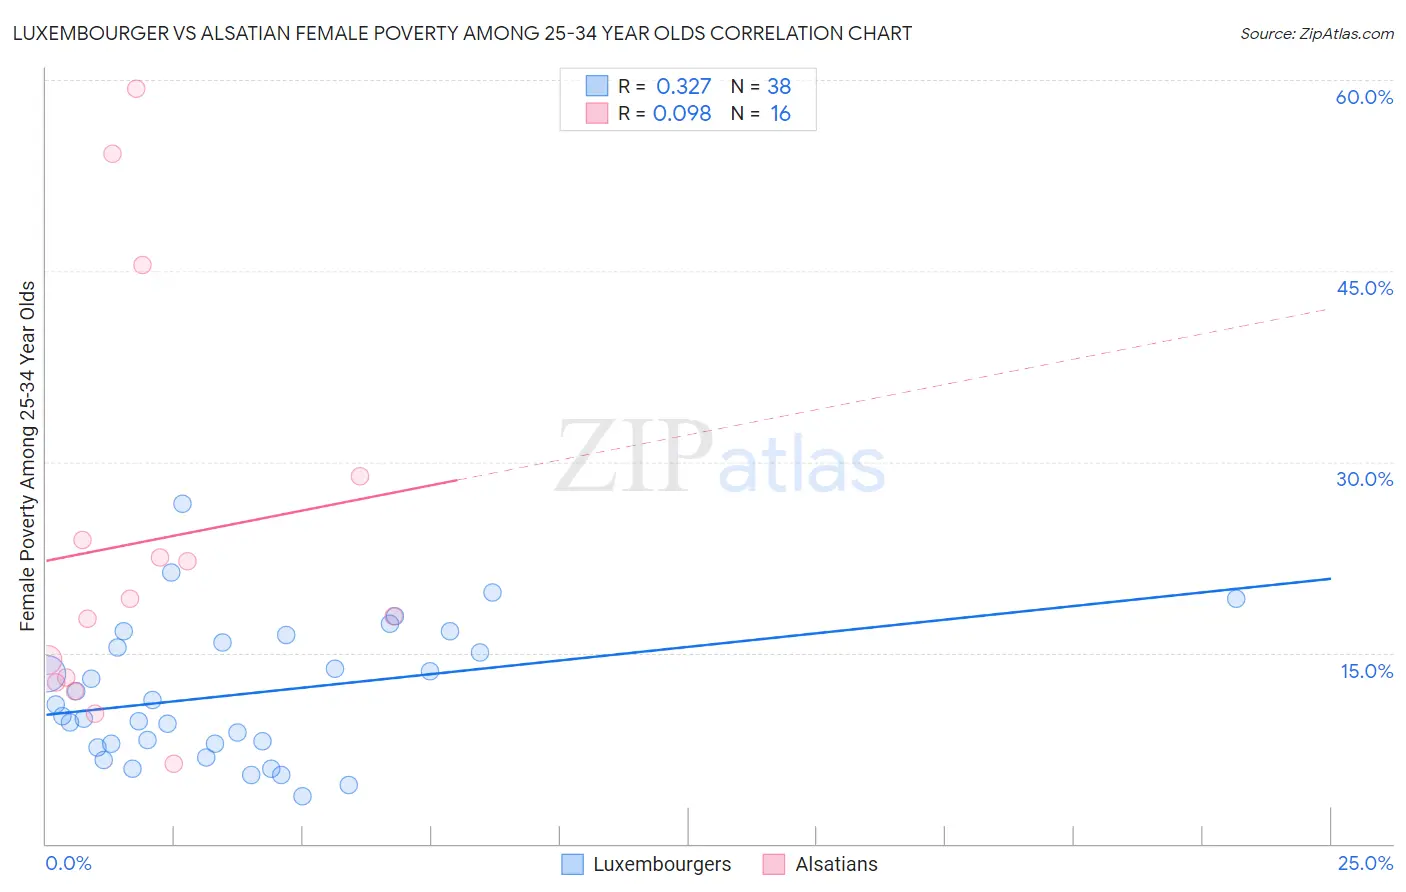
Luxembourger vs Alsatian Female Poverty Among 25-34 Year Olds Correlation Chart
The statistical analysis conducted on geographies consisting of 143,147,078 people shows a mild positive correlation between the proportion of Luxembourgers and poverty level among females between the ages 25 and 34 in the United States with a correlation coefficient (R) of 0.327 and weighted average of 12.1%. Similarly, the statistical analysis conducted on geographies consisting of 82,102,857 people shows a slight positive correlation between the proportion of Alsatians and poverty level among females between the ages 25 and 34 in the United States with a correlation coefficient (R) of 0.098 and weighted average of 14.7%, a difference of 22.1%.
Female Poverty Among 25-34 Year Olds Correlation Summary
| Measurement | Luxembourger | Alsatian |
| Minimum | 3.7% | 6.2% |
| Maximum | 26.7% | 59.3% |
| Range | 23.0% | 53.1% |
| Mean | 11.8% | 23.7% |
| Median | 10.5% | 18.5% |
| Interquartile 25% (IQ1) | 7.8% | 12.9% |
| Interquartile 75% (IQ3) | 15.8% | 26.4% |
| Interquartile Range (IQR) | 8.0% | 13.4% |
| Standard Deviation (Sample) | 5.3% | 15.8% |
| Standard Deviation (Population) | 5.2% | 15.3% |
Similar Demographics by Female Poverty Among 25-34 Year Olds
Demographics Similar to Luxembourgers by Female Poverty Among 25-34 Year Olds
In terms of female poverty among 25-34 year olds, the demographic groups most similar to Luxembourgers are Jordanian (12.1%, a difference of 0.020%), Immigrants from Romania (12.1%, a difference of 0.22%), Russian (12.1%, a difference of 0.23%), Immigrants from Northern Europe (12.1%, a difference of 0.31%), and Immigrants from Philippines (12.0%, a difference of 0.33%).
| Demographics | Rating | Rank | Female Poverty Among 25-34 Year Olds |
| Immigrants | Egypt | 99.6 /100 | #49 | Exceptional 12.0% |
| Immigrants | Croatia | 99.6 /100 | #50 | Exceptional 12.0% |
| Paraguayans | 99.6 /100 | #51 | Exceptional 12.0% |
| Immigrants | Eastern Europe | 99.6 /100 | #52 | Exceptional 12.0% |
| Immigrants | Israel | 99.6 /100 | #53 | Exceptional 12.0% |
| Eastern Europeans | 99.6 /100 | #54 | Exceptional 12.0% |
| Immigrants | Philippines | 99.5 /100 | #55 | Exceptional 12.0% |
| Luxembourgers | 99.5 /100 | #56 | Exceptional 12.1% |
| Jordanians | 99.4 /100 | #57 | Exceptional 12.1% |
| Immigrants | Romania | 99.4 /100 | #58 | Exceptional 12.1% |
| Russians | 99.4 /100 | #59 | Exceptional 12.1% |
| Immigrants | Northern Europe | 99.4 /100 | #60 | Exceptional 12.1% |
| Immigrants | Czechoslovakia | 99.4 /100 | #61 | Exceptional 12.1% |
| Immigrants | Moldova | 99.3 /100 | #62 | Exceptional 12.1% |
| Soviet Union | 99.3 /100 | #63 | Exceptional 12.1% |
Demographics Similar to Alsatians by Female Poverty Among 25-34 Year Olds
In terms of female poverty among 25-34 year olds, the demographic groups most similar to Alsatians are Malaysian (14.7%, a difference of 0.030%), Salvadoran (14.7%, a difference of 0.040%), Immigrants from Ghana (14.7%, a difference of 0.040%), Immigrants from Jamaica (14.7%, a difference of 0.060%), and Immigrants from Grenada (14.7%, a difference of 0.080%).
| Demographics | Rating | Rank | Female Poverty Among 25-34 Year Olds |
| Delaware | 2.3 /100 | #231 | Tragic 14.6% |
| Immigrants | Ecuador | 1.9 /100 | #232 | Tragic 14.6% |
| Whites/Caucasians | 1.8 /100 | #233 | Tragic 14.7% |
| Cubans | 1.6 /100 | #234 | Tragic 14.7% |
| Immigrants | Jamaica | 1.4 /100 | #235 | Tragic 14.7% |
| Salvadorans | 1.4 /100 | #236 | Tragic 14.7% |
| Immigrants | Ghana | 1.4 /100 | #237 | Tragic 14.7% |
| Alsatians | 1.4 /100 | #238 | Tragic 14.7% |
| Malaysians | 1.4 /100 | #239 | Tragic 14.7% |
| Immigrants | Grenada | 1.3 /100 | #240 | Tragic 14.7% |
| Scotch-Irish | 1.2 /100 | #241 | Tragic 14.8% |
| Barbadians | 1.2 /100 | #242 | Tragic 14.8% |
| Immigrants | Nicaragua | 1.1 /100 | #243 | Tragic 14.8% |
| Immigrants | Bangladesh | 1.1 /100 | #244 | Tragic 14.8% |
| Immigrants | Middle Africa | 1.0 /100 | #245 | Tragic 14.8% |