Lithuanian vs Syrian Householder Income Under 25 years

COMPARE

Lithuanian
Race
Ancestry
AfghanAfricanAlaska NativeAlaskan AthabascanAlbanianAleutAlsatianAmericanApacheArabArapahoArgentineanArmenianAssyrian/Chaldean/SyriacAustralianAustrianBahamianBangladeshiBarbadianBasqueBelgianBelizeanBermudanBhutaneseBlackfeetBolivianBrazilianBritishBritish West IndianBulgarianBurmeseCajunCambodianCanadianCape VerdeanCarpatho RusynCelticCentral AmericanCentral American IndianCherokeeCheyenneChickasawChileanChineseChippewaChoctawColombianColvilleComancheCosta RicanCreeCreekCroatianCrowCubanCypriotCzechCzechoslovakianDanishDelawareDominicanDutchDutch West IndianEastern EuropeanEcuadorianEgyptianEnglishEstonianEthiopianEuropeanFijianFilipinoFinnishFrenchFrench American IndianFrench CanadianGermanGerman RussianGhanaianGreekGuamanian/ChamorroGuatemalanGuyaneseHaitianHmongHonduranHopiHoumaHungarianIcelanderIndian (Asian)IndonesianInupiatIranianIraqiIrishIroquoisIsraeliItalianJamaicanJapaneseJordanianKenyanKiowaKoreanLaotianLatvianLebaneseLiberianLithuanianLumbeeLuxembourgerMacedonianMalaysianMalteseMarshalleseMenomineeMexicanMexican American IndianMongolianMoroccanNative HawaiianNavajoNepaleseNew ZealanderNicaraguanNigerianNorthern EuropeanNorwegianOkinawanOsageOttawaPaiutePakistaniPalestinianPanamanianParaguayanPennsylvania GermanPeruvianPimaPolishPortuguesePotawatomiPuebloPuerto RicanPuget Sound SalishRomanianRussianSalvadoranSamoanScandinavianScotch-IrishScottishSeminoleSenegaleseSerbianShoshoneSierra LeoneanSiouxSlavicSlovakSloveneSomaliSouth AfricanSouth AmericanSouth American IndianSoviet UnionSpaniardSpanishSpanish AmericanSpanish American IndianSri LankanSubsaharan AfricanSudaneseSwedishSwissTaiwaneseThaiTlingit-HaidaTohono O'OdhamTonganTrinidadian and TobagonianTsimshianTurkishU.S. Virgin IslanderUgandanUkrainianUruguayanUteVenezuelanVietnameseWelshWest IndianYakamaYaquiYugoslavianYumanYup'ikZimbabwean
Immigration
NonimmigrantsImmigrantsAfghanistanAfricaAlbaniaArgentinaArmeniaAsiaAustraliaAustriaBahamasBangladeshBarbadosBelarusBelgiumBelizeBoliviaBosnia and HerzegovinaBrazilBulgariaBurma/MyanmarCabo VerdeCambodiaCameroonCanadaCaribbeanCentral AmericaChileChinaColombiaCongoCosta RicaCroatiaCubaCzechoslovakiaDenmarkDominicaDominican RepublicEastern AfricaEastern AsiaEastern EuropeEcuadorEgyptEl SalvadorEnglandEritreaEthiopiaEuropeFijiFranceGermanyGhanaGreeceGrenadaGuatemalaGuyanaHaitiHondurasHong KongHungaryIndiaIndonesiaIranIraqIrelandIsraelItalyJamaicaJapanJordanKazakhstanKenyaKoreaKuwaitLaosLatin AmericaLatviaLebanonLiberiaLithuaniaMalaysiaMexicoMicronesiaMiddle AfricaMoldovaMoroccoNepalNetherlandsNicaraguaNigeriaNorth AmericaNorth MacedoniaNorthern AfricaNorthern EuropeNorwayOceaniaPakistanPanamaPeruPhilippinesPolandPortugalRomaniaRussiaSaudi ArabiaScotlandSenegalSerbiaSierra LeoneSingaporeSomaliaSouth AfricaSouth AmericaSouth Central AsiaSouth Eastern AsiaSouthern EuropeSpainSri LankaSt. Vincent and the GrenadinesSudanSwedenSwitzerlandSyriaTaiwanThailandTrinidad and TobagoTurkeyUgandaUkraineUruguayUzbekistanVenezuelaVietnamWest IndiesWestern AfricaWestern AsiaWestern EuropeYemenZaireZimbabweAzores
Syrian
Race
Ancestry
AfghanAfricanAlaska NativeAlaskan AthabascanAlbanianAleutAlsatianAmericanApacheArabArapahoArgentineanArmenianAssyrian/Chaldean/SyriacAustralianAustrianBahamianBangladeshiBarbadianBasqueBelgianBelizeanBermudanBhutaneseBlackfeetBolivianBrazilianBritishBritish West IndianBulgarianBurmeseCajunCambodianCanadianCape VerdeanCarpatho RusynCelticCentral AmericanCentral American IndianCherokeeCheyenneChickasawChileanChineseChippewaChoctawColombianColvilleComancheCosta RicanCreeCreekCroatianCrowCubanCypriotCzechCzechoslovakianDanishDelawareDominicanDutchDutch West IndianEastern EuropeanEcuadorianEgyptianEnglishEstonianEthiopianEuropeanFijianFilipinoFinnishFrenchFrench American IndianFrench CanadianGermanGerman RussianGhanaianGreekGuamanian/ChamorroGuatemalanGuyaneseHaitianHmongHonduranHopiHoumaHungarianIcelanderIndian (Asian)IndonesianInupiatIranianIraqiIrishIroquoisIsraeliItalianJamaicanJapaneseJordanianKenyanKiowaKoreanLaotianLatvianLebaneseLiberianLumbeeLuxembourgerMacedonianMalaysianMalteseMarshalleseMenomineeMexicanMexican American IndianMongolianMoroccanNative HawaiianNavajoNepaleseNew ZealanderNicaraguanNigerianNorthern EuropeanNorwegianOkinawanOsageOttawaPaiutePakistaniPalestinianPanamanianParaguayanPennsylvania GermanPeruvianPimaPolishPortuguesePotawatomiPuebloPuerto RicanPuget Sound SalishRomanianRussianSalvadoranSamoanScandinavianScotch-IrishScottishSeminoleSenegaleseSerbianShoshoneSierra LeoneanSiouxSlavicSlovakSloveneSomaliSouth AfricanSouth AmericanSouth American IndianSoviet UnionSpaniardSpanishSpanish AmericanSpanish American IndianSri LankanSubsaharan AfricanSudaneseSwedishSwissSyrianTaiwaneseThaiTlingit-HaidaTohono O'OdhamTonganTrinidadian and TobagonianTsimshianTurkishU.S. Virgin IslanderUgandanUkrainianUruguayanUteVenezuelanVietnameseWelshWest IndianYakamaYaquiYugoslavianYumanYup'ikZimbabwean
Immigration
NonimmigrantsImmigrantsAfghanistanAfricaAlbaniaArgentinaArmeniaAsiaAustraliaAustriaBahamasBangladeshBarbadosBelarusBelgiumBelizeBoliviaBosnia and HerzegovinaBrazilBulgariaBurma/MyanmarCabo VerdeCambodiaCameroonCanadaCaribbeanCentral AmericaChileChinaColombiaCongoCosta RicaCroatiaCubaCzechoslovakiaDenmarkDominicaDominican RepublicEastern AfricaEastern AsiaEastern EuropeEcuadorEgyptEl SalvadorEnglandEritreaEthiopiaEuropeFijiFranceGermanyGhanaGreeceGrenadaGuatemalaGuyanaHaitiHondurasHong KongHungaryIndiaIndonesiaIranIraqIrelandIsraelItalyJamaicaJapanJordanKazakhstanKenyaKoreaKuwaitLaosLatin AmericaLatviaLebanonLiberiaLithuaniaMalaysiaMexicoMicronesiaMiddle AfricaMoldovaMoroccoNepalNetherlandsNicaraguaNigeriaNorth AmericaNorth MacedoniaNorthern AfricaNorthern EuropeNorwayOceaniaPakistanPanamaPeruPhilippinesPolandPortugalRomaniaRussiaSaudi ArabiaScotlandSenegalSerbiaSierra LeoneSingaporeSomaliaSouth AfricaSouth AmericaSouth Central AsiaSouth Eastern AsiaSouthern EuropeSpainSri LankaSt. Vincent and the GrenadinesSudanSwedenSwitzerlandSyriaTaiwanThailandTrinidad and TobagoTurkeyUgandaUkraineUruguayUzbekistanVenezuelaVietnamWest IndiesWestern AfricaWestern AsiaWestern EuropeYemenZaireZimbabweAzores
Householder Income Under 25 years
Income
Poverty
Unemployment
Labor Participation
Family Structure
Vehicle Availability
Education Level
Disability

Householder Income Under 25 years Comparison

Lithuanians

Syrians

Exceptional
Poor
$53,552
HOUSEHOLDER INCOME UNDER 25 YEARS
96.6/ 100
METRIC RATING
117th/ 347
METRIC RANK
$51,353
HOUSEHOLDER INCOME UNDER 25 YEARS
11.4/ 100
METRIC RATING
209th/ 347
METRIC RANK

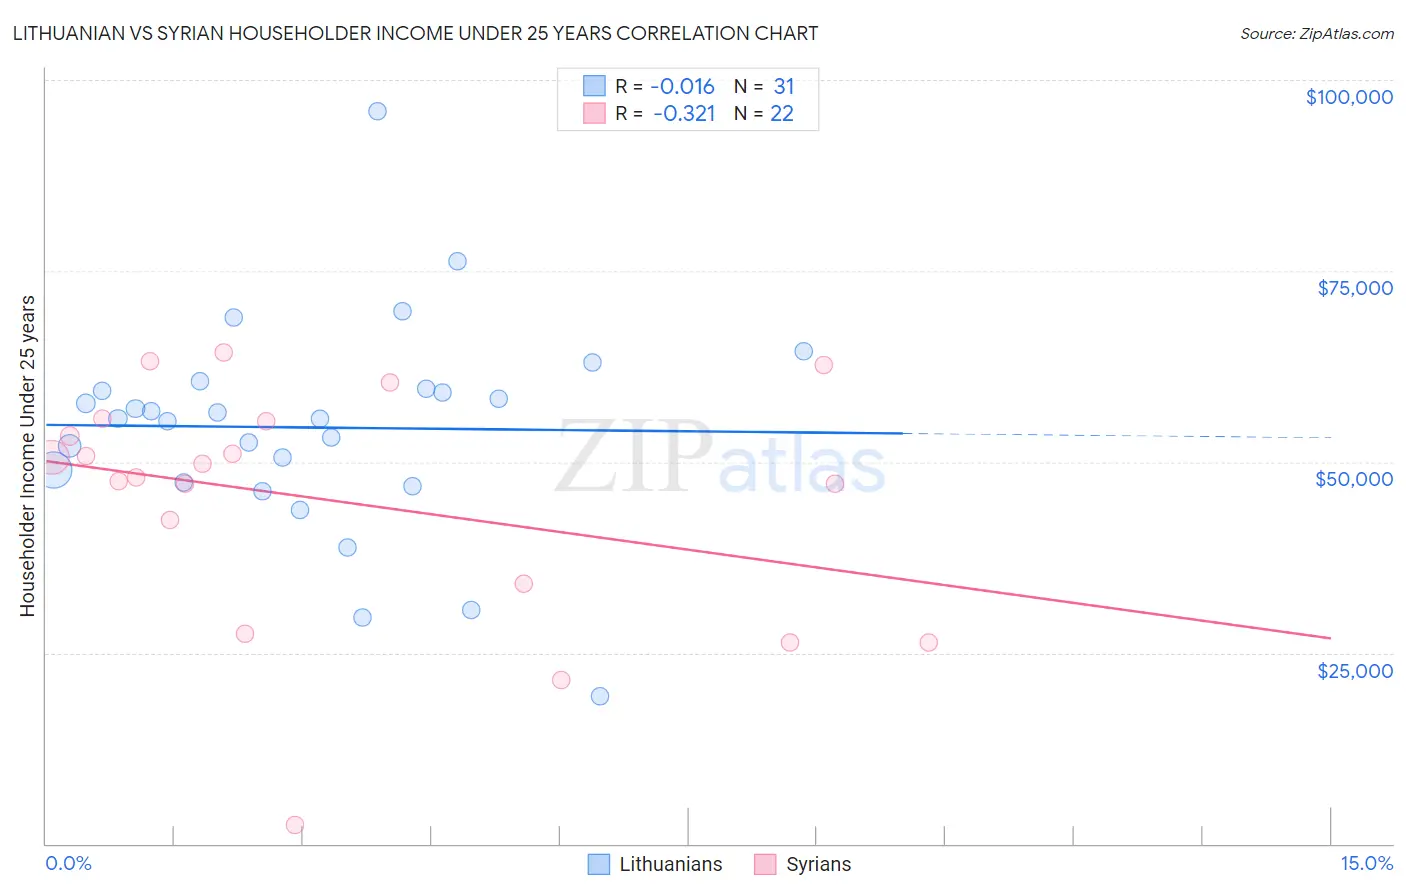
Lithuanian vs Syrian Householder Income Under 25 years Correlation Chart

The statistical analysis conducted on geographies consisting of 345,043,836 people shows no correlation between the proportion of Lithuanians and household income with householder under the age of 25 in the United States with a correlation coefficient (R) of -0.016 and weighted average of $53,552. Similarly, the statistical analysis conducted on geographies consisting of 232,232,125 people shows a mild negative correlation between the proportion of Syrians and household income with householder under the age of 25 in the United States with a correlation coefficient (R) of -0.321 and weighted average of $51,353, a difference of 4.3%.
Lithuanian vs Syrian Householder Income Under 25 years

Householder Income Under 25 years Correlation Summary

MeasurementLithuanianSyrian
Minimum$19,375$2,499
Maximum$95,845$64,366
Range$76,470$61,867
Mean$54,494$44,870
Median$55,664$48,867
Interquartile 25% (IQ1)$47,340$33,995
Interquartile 75% (IQ3)$59,595$55,261
Interquartile Range (IQR)$12,255$21,267
Standard Deviation (Sample)$14,114$15,709
Standard Deviation (Population)$13,885$15,348

Similar Demographics by Householder Income Under 25 years

Demographics Similar to Lithuanians by Householder Income Under 25 years

In terms of householder income under 25 years, the demographic groups most similar to Lithuanians are Immigrants from Spain ($53,560, a difference of 0.010%), Immigrants from Switzerland ($53,528, a difference of 0.050%), Immigrants from Albania ($53,597, a difference of 0.080%), Immigrants from Sweden ($53,621, a difference of 0.13%), and Romanian ($53,632, a difference of 0.15%).
DemographicsRating | RankHouseholder Income Under 25 years
Greeks
97.7
/100
|
#110
Exceptional
$53,715
Immigrants | Colombia
97.7
/100
|
#111
Exceptional
$53,714
Immigrants | Oceania
97.5
/100
|
#112
Exceptional
$53,680
Romanians
97.2
/100
|
#113
Exceptional
$53,632
Immigrants | Sweden
97.1
/100
|
#114
Exceptional
$53,621
Immigrants | Albania
96.9
/100
|
#115
Exceptional
$53,597
Immigrants | Spain
96.6
/100
|
#116
Exceptional
$53,560
Lithuanians
96.6
/100
|
#117
Exceptional
$53,552
Immigrants | Switzerland
96.3
/100
|
#118
Exceptional
$53,528
Italians
95.4
/100
|
#119
Exceptional
$53,426
Guamanians/Chamorros
95.3
/100
|
#120
Exceptional
$53,423
Immigrants | Canada
95.2
/100
|
#121
Exceptional
$53,411
Immigrants | Ethiopia
95.2
/100
|
#122
Exceptional
$53,408
Immigrants | Iraq
94.9
/100
|
#123
Exceptional
$53,384
Colombians
94.6
/100
|
#124
Exceptional
$53,357

Demographics Similar to Syrians by Householder Income Under 25 years

In terms of householder income under 25 years, the demographic groups most similar to Syrians are Immigrants from Jordan ($51,370, a difference of 0.030%), Immigrants from Ghana ($51,333, a difference of 0.040%), South African ($51,383, a difference of 0.060%), Cape Verdean ($51,387, a difference of 0.070%), and Immigrants from Latin America ($51,387, a difference of 0.070%).
DemographicsRating | RankHouseholder Income Under 25 years
Immigrants | Guatemala
14.0
/100
|
#202
Poor
$51,447
Immigrants | Cameroon
13.6
/100
|
#203
Poor
$51,433
Czechs
13.2
/100
|
#204
Poor
$51,421
Cape Verdeans
12.3
/100
|
#205
Poor
$51,387
Immigrants | Latin America
12.3
/100
|
#206
Poor
$51,387
South Africans
12.2
/100
|
#207
Poor
$51,383
Immigrants | Jordan
11.9
/100
|
#208
Poor
$51,370
Syrians
11.4
/100
|
#209
Poor
$51,353
Immigrants | Ghana
10.9
/100
|
#210
Poor
$51,333
Irish
10.6
/100
|
#211
Poor
$51,317
Immigrants | Panama
9.7
/100
|
#212
Tragic
$51,278
Dutch
9.4
/100
|
#213
Tragic
$51,265
Zimbabweans
9.3
/100
|
#214
Tragic
$51,259
Icelanders
9.1
/100
|
#215
Tragic
$51,247
French
8.7
/100
|
#216
Tragic
$51,230