Immigrants from South Africa vs Immigrants from Austria Householder Income Under 25 years
COMPARE
Immigrants from South Africa
Immigrants from Austria
Householder Income Under 25 years
Householder Income Under 25 years Comparison
Immigrants from South Africa
Immigrants from Austria
$51,705
HOUSEHOLDER INCOME UNDER 25 YEARS
23.4/ 100
METRIC RATING
187th/ 347
METRIC RANK
$52,400
HOUSEHOLDER INCOME UNDER 25 YEARS
62.6/ 100
METRIC RATING
166th/ 347
METRIC RANK
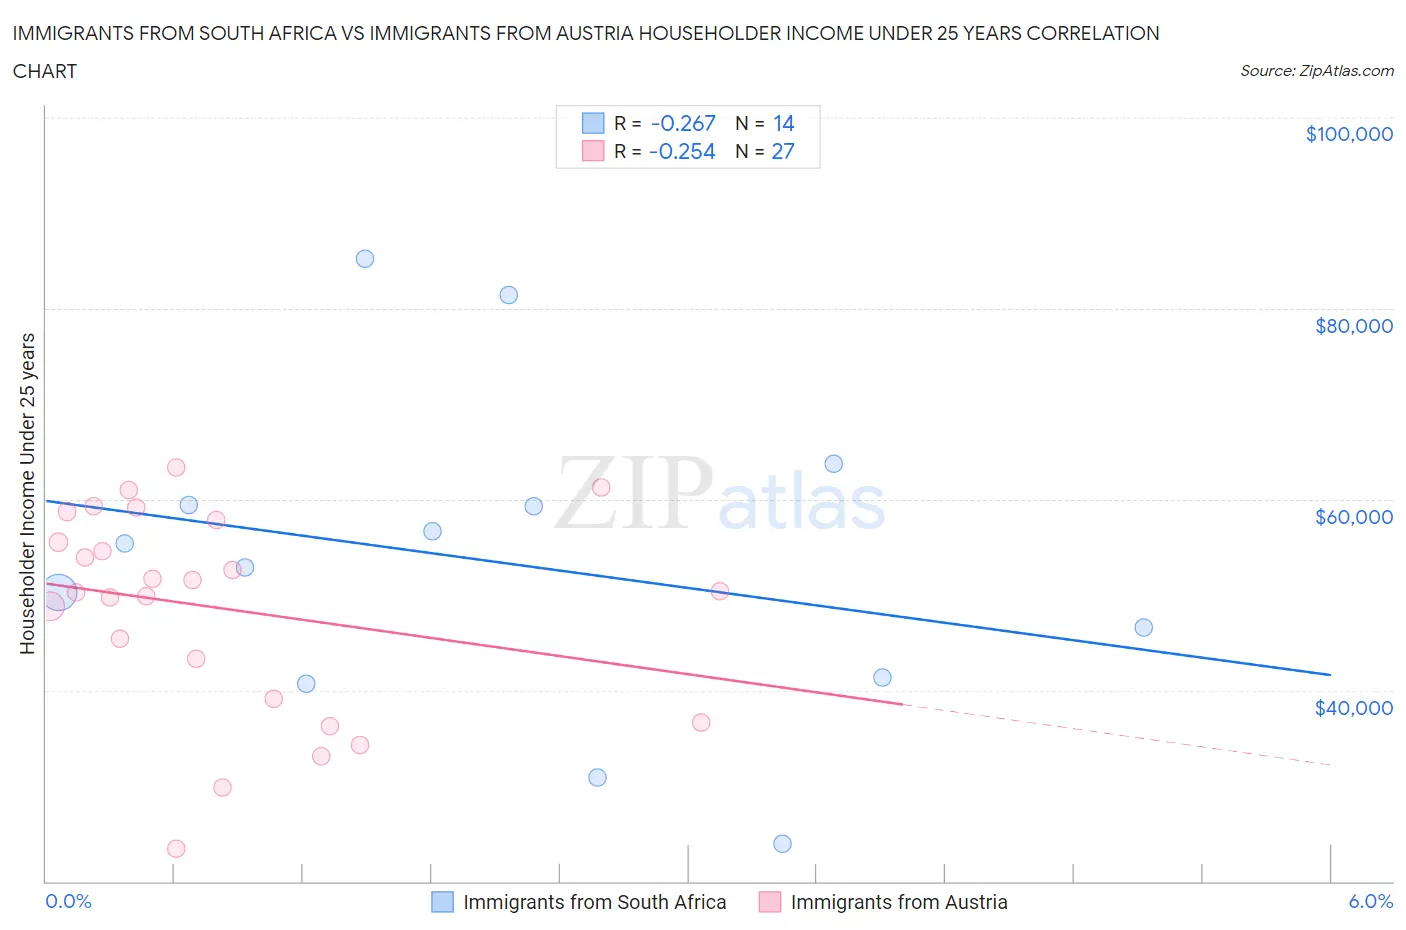
Immigrants from South Africa vs Immigrants from Austria Householder Income Under 25 years Correlation Chart
The statistical analysis conducted on geographies consisting of 203,386,126 people shows a weak negative correlation between the proportion of Immigrants from South Africa and household income with householder under the age of 25 in the United States with a correlation coefficient (R) of -0.267 and weighted average of $51,705. Similarly, the statistical analysis conducted on geographies consisting of 148,326,124 people shows a weak negative correlation between the proportion of Immigrants from Austria and household income with householder under the age of 25 in the United States with a correlation coefficient (R) of -0.254 and weighted average of $52,400, a difference of 1.3%.
Householder Income Under 25 years Correlation Summary
| Measurement | Immigrants from South Africa | Immigrants from Austria |
| Minimum | $23,889 | $23,462 |
| Maximum | $85,165 | $63,282 |
| Range | $61,276 | $39,820 |
| Mean | $53,389 | $48,547 |
| Median | $54,131 | $50,350 |
| Interquartile 25% (IQ1) | $41,391 | $39,087 |
| Interquartile 75% (IQ3) | $59,362 | $57,875 |
| Interquartile Range (IQR) | $17,971 | $18,788 |
| Standard Deviation (Sample) | $16,934 | $10,655 |
| Standard Deviation (Population) | $16,318 | $10,456 |
Similar Demographics by Householder Income Under 25 years
Demographics Similar to Immigrants from South Africa by Householder Income Under 25 years
In terms of householder income under 25 years, the demographic groups most similar to Immigrants from South Africa are Alaskan Athabascan ($51,713, a difference of 0.020%), Northern European ($51,678, a difference of 0.050%), Immigrants from Latvia ($51,737, a difference of 0.060%), Paiute ($51,743, a difference of 0.070%), and Croatian ($51,662, a difference of 0.080%).
| Demographics | Rating | Rank | Householder Income Under 25 years |
| Immigrants | England | 28.7 /100 | #180 | Fair $51,817 |
| Europeans | 27.6 /100 | #181 | Fair $51,796 |
| Jordanians | 27.6 /100 | #182 | Fair $51,796 |
| Mexican American Indians | 27.0 /100 | #183 | Fair $51,783 |
| Paiute | 25.1 /100 | #184 | Fair $51,743 |
| Immigrants | Latvia | 24.8 /100 | #185 | Fair $51,737 |
| Alaskan Athabascans | 23.8 /100 | #186 | Fair $51,713 |
| Immigrants | South Africa | 23.4 /100 | #187 | Fair $51,705 |
| Northern Europeans | 22.2 /100 | #188 | Fair $51,678 |
| Croatians | 21.6 /100 | #189 | Fair $51,662 |
| Malaysians | 19.7 /100 | #190 | Poor $51,615 |
| Panamanians | 19.5 /100 | #191 | Poor $51,611 |
| West Indians | 18.5 /100 | #192 | Poor $51,583 |
| Immigrants | Eritrea | 18.1 /100 | #193 | Poor $51,574 |
| Guatemalans | 16.4 /100 | #194 | Poor $51,525 |
Demographics Similar to Immigrants from Austria by Householder Income Under 25 years
In terms of householder income under 25 years, the demographic groups most similar to Immigrants from Austria are Polish ($52,407, a difference of 0.010%), Immigrants from Uganda ($52,374, a difference of 0.050%), Immigrants from Trinidad and Tobago ($52,437, a difference of 0.070%), Japanese ($52,365, a difference of 0.070%), and Immigrants from Chile ($52,440, a difference of 0.080%).
| Demographics | Rating | Rank | Householder Income Under 25 years |
| Mongolians | 70.2 /100 | #159 | Good $52,540 |
| Immigrants | Turkey | 68.3 /100 | #160 | Good $52,503 |
| Uruguayans | 66.2 /100 | #161 | Good $52,465 |
| Immigrants | Cambodia | 65.4 /100 | #162 | Good $52,450 |
| Immigrants | Chile | 64.8 /100 | #163 | Good $52,440 |
| Immigrants | Trinidad and Tobago | 64.7 /100 | #164 | Good $52,437 |
| Poles | 63.0 /100 | #165 | Good $52,407 |
| Immigrants | Austria | 62.6 /100 | #166 | Good $52,400 |
| Immigrants | Uganda | 61.1 /100 | #167 | Good $52,374 |
| Japanese | 60.5 /100 | #168 | Good $52,365 |
| Canadians | 58.8 /100 | #169 | Average $52,336 |
| Israelis | 58.8 /100 | #170 | Average $52,335 |
| Immigrants | Uruguay | 56.8 /100 | #171 | Average $52,302 |
| Cypriots | 51.2 /100 | #172 | Average $52,209 |
| Barbadians | 50.8 /100 | #173 | Average $52,202 |