Immigrants from Moldova vs Immigrants from Austria Householder Income Under 25 years
COMPARE
Immigrants from Moldova
Immigrants from Austria
Householder Income Under 25 years
Householder Income Under 25 years Comparison
Immigrants from Moldova
Immigrants from Austria
$56,168
HOUSEHOLDER INCOME UNDER 25 YEARS
100.0/ 100
METRIC RATING
30th/ 347
METRIC RANK
$52,400
HOUSEHOLDER INCOME UNDER 25 YEARS
62.6/ 100
METRIC RATING
166th/ 347
METRIC RANK
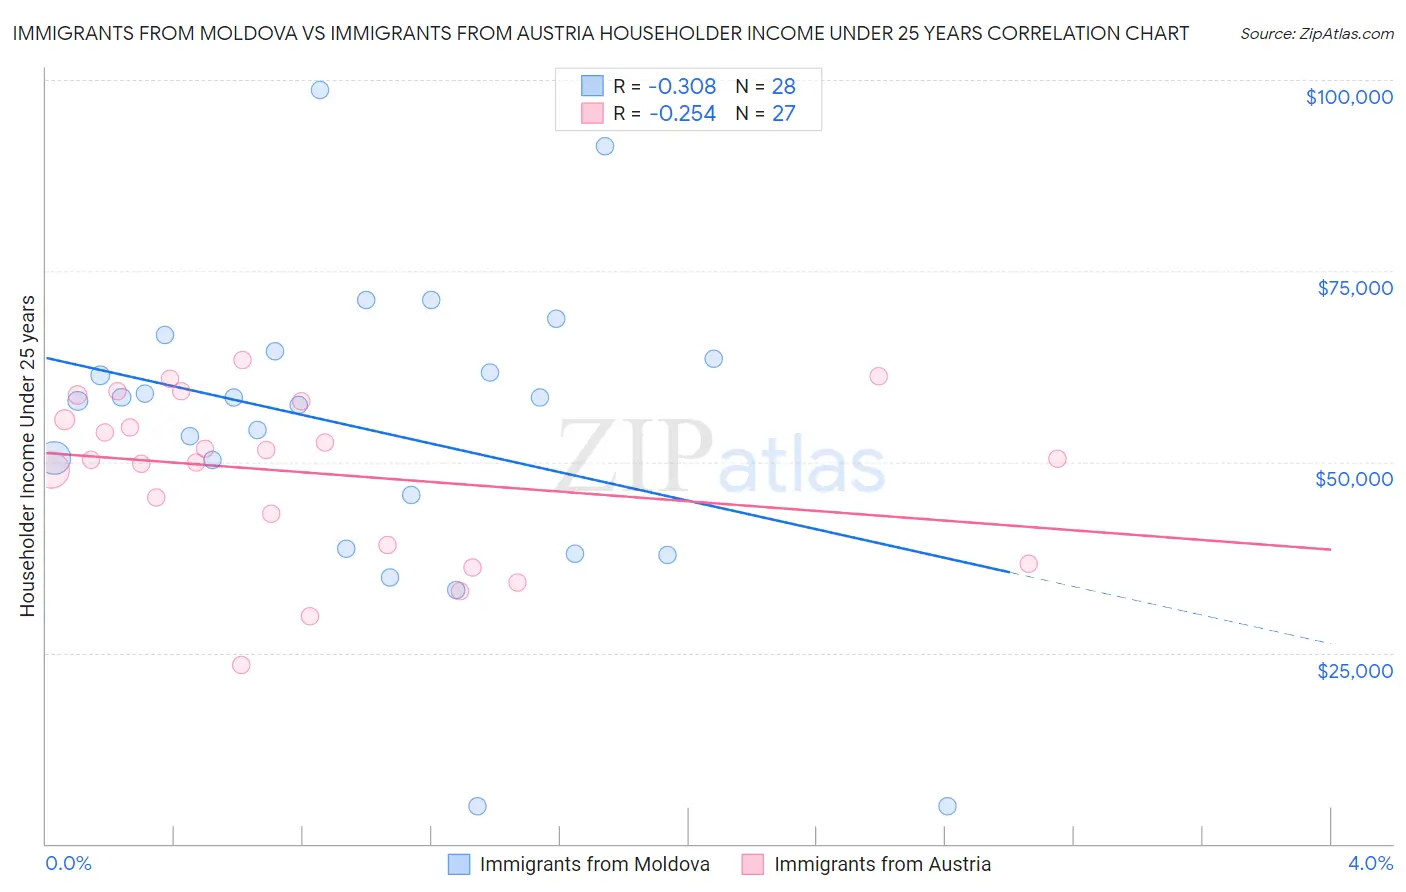
Immigrants from Moldova vs Immigrants from Austria Householder Income Under 25 years Correlation Chart
The statistical analysis conducted on geographies consisting of 112,044,637 people shows a mild negative correlation between the proportion of Immigrants from Moldova and household income with householder under the age of 25 in the United States with a correlation coefficient (R) of -0.308 and weighted average of $56,168. Similarly, the statistical analysis conducted on geographies consisting of 148,326,124 people shows a weak negative correlation between the proportion of Immigrants from Austria and household income with householder under the age of 25 in the United States with a correlation coefficient (R) of -0.254 and weighted average of $52,400, a difference of 7.2%.
Householder Income Under 25 years Correlation Summary
| Measurement | Immigrants from Moldova | Immigrants from Austria |
| Minimum | $4,881 | $23,462 |
| Maximum | $98,750 | $63,282 |
| Range | $93,869 | $39,820 |
| Mean | $54,102 | $48,547 |
| Median | $58,227 | $50,350 |
| Interquartile 25% (IQ1) | $42,159 | $39,087 |
| Interquartile 75% (IQ3) | $64,005 | $57,875 |
| Interquartile Range (IQR) | $21,847 | $18,788 |
| Standard Deviation (Sample) | $20,418 | $10,655 |
| Standard Deviation (Population) | $20,050 | $10,456 |
Similar Demographics by Householder Income Under 25 years
Demographics Similar to Immigrants from Moldova by Householder Income Under 25 years
In terms of householder income under 25 years, the demographic groups most similar to Immigrants from Moldova are Vietnamese ($56,127, a difference of 0.070%), Peruvian ($56,052, a difference of 0.21%), Immigrants from Asia ($56,379, a difference of 0.37%), Immigrants from Peru ($56,384, a difference of 0.38%), and Inupiat ($55,935, a difference of 0.42%).
| Demographics | Rating | Rank | Householder Income Under 25 years |
| Tongans | 100.0 /100 | #23 | Exceptional $56,972 |
| Immigrants | Singapore | 100.0 /100 | #24 | Exceptional $56,835 |
| Immigrants | Pakistan | 100.0 /100 | #25 | Exceptional $56,789 |
| Immigrants | Australia | 100.0 /100 | #26 | Exceptional $56,660 |
| Immigrants | North Macedonia | 100.0 /100 | #27 | Exceptional $56,503 |
| Immigrants | Peru | 100.0 /100 | #28 | Exceptional $56,384 |
| Immigrants | Asia | 100.0 /100 | #29 | Exceptional $56,379 |
| Immigrants | Moldova | 100.0 /100 | #30 | Exceptional $56,168 |
| Vietnamese | 100.0 /100 | #31 | Exceptional $56,127 |
| Peruvians | 100.0 /100 | #32 | Exceptional $56,052 |
| Inupiat | 100.0 /100 | #33 | Exceptional $55,935 |
| Immigrants | Japan | 100.0 /100 | #34 | Exceptional $55,932 |
| Tlingit-Haida | 100.0 /100 | #35 | Exceptional $55,914 |
| Immigrants | Israel | 100.0 /100 | #36 | Exceptional $55,913 |
| Immigrants | Russia | 100.0 /100 | #37 | Exceptional $55,891 |
Demographics Similar to Immigrants from Austria by Householder Income Under 25 years
In terms of householder income under 25 years, the demographic groups most similar to Immigrants from Austria are Polish ($52,407, a difference of 0.010%), Immigrants from Uganda ($52,374, a difference of 0.050%), Immigrants from Trinidad and Tobago ($52,437, a difference of 0.070%), Japanese ($52,365, a difference of 0.070%), and Immigrants from Chile ($52,440, a difference of 0.080%).
| Demographics | Rating | Rank | Householder Income Under 25 years |
| Mongolians | 70.2 /100 | #159 | Good $52,540 |
| Immigrants | Turkey | 68.3 /100 | #160 | Good $52,503 |
| Uruguayans | 66.2 /100 | #161 | Good $52,465 |
| Immigrants | Cambodia | 65.4 /100 | #162 | Good $52,450 |
| Immigrants | Chile | 64.8 /100 | #163 | Good $52,440 |
| Immigrants | Trinidad and Tobago | 64.7 /100 | #164 | Good $52,437 |
| Poles | 63.0 /100 | #165 | Good $52,407 |
| Immigrants | Austria | 62.6 /100 | #166 | Good $52,400 |
| Immigrants | Uganda | 61.1 /100 | #167 | Good $52,374 |
| Japanese | 60.5 /100 | #168 | Good $52,365 |
| Canadians | 58.8 /100 | #169 | Average $52,336 |
| Israelis | 58.8 /100 | #170 | Average $52,335 |
| Immigrants | Uruguay | 56.8 /100 | #171 | Average $52,302 |
| Cypriots | 51.2 /100 | #172 | Average $52,209 |
| Barbadians | 50.8 /100 | #173 | Average $52,202 |