Immigrants from Netherlands vs Immigrants from Austria Householder Income Under 25 years
COMPARE
Immigrants from Netherlands
Immigrants from Austria
Householder Income Under 25 years
Householder Income Under 25 years Comparison
Immigrants from Netherlands
Immigrants from Austria
$52,592
HOUSEHOLDER INCOME UNDER 25 YEARS
72.8/ 100
METRIC RATING
158th/ 347
METRIC RANK
$52,400
HOUSEHOLDER INCOME UNDER 25 YEARS
62.6/ 100
METRIC RATING
166th/ 347
METRIC RANK
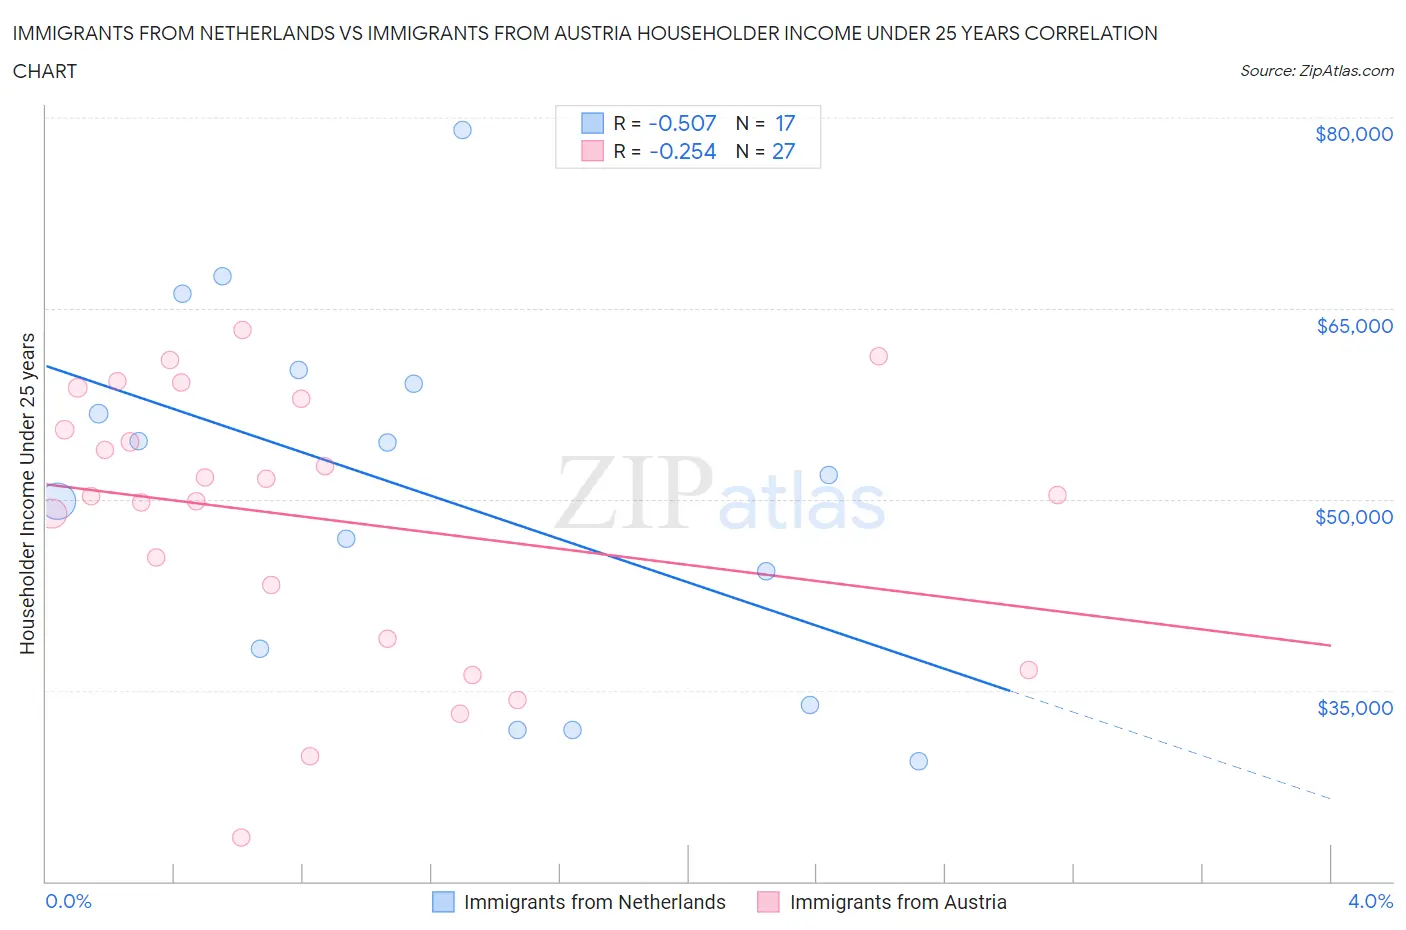
Immigrants from Netherlands vs Immigrants from Austria Householder Income Under 25 years Correlation Chart
The statistical analysis conducted on geographies consisting of 207,489,365 people shows a substantial negative correlation between the proportion of Immigrants from Netherlands and household income with householder under the age of 25 in the United States with a correlation coefficient (R) of -0.507 and weighted average of $52,592. Similarly, the statistical analysis conducted on geographies consisting of 148,326,124 people shows a weak negative correlation between the proportion of Immigrants from Austria and household income with householder under the age of 25 in the United States with a correlation coefficient (R) of -0.254 and weighted average of $52,400, a difference of 0.37%.
Householder Income Under 25 years Correlation Summary
| Measurement | Immigrants from Netherlands | Immigrants from Austria |
| Minimum | $29,438 | $23,462 |
| Maximum | $79,004 | $63,282 |
| Range | $49,567 | $39,820 |
| Mean | $50,356 | $48,547 |
| Median | $51,917 | $50,350 |
| Interquartile 25% (IQ1) | $36,019 | $39,087 |
| Interquartile 75% (IQ3) | $59,656 | $57,875 |
| Interquartile Range (IQR) | $23,637 | $18,788 |
| Standard Deviation (Sample) | $14,151 | $10,655 |
| Standard Deviation (Population) | $13,728 | $10,456 |
Demographics Similar to Immigrants from Netherlands and Immigrants from Austria by Householder Income Under 25 years
In terms of householder income under 25 years, the demographic groups most similar to Immigrants from Netherlands are Ghanaian ($52,594, a difference of 0.0%), Immigrants from Denmark ($52,612, a difference of 0.040%), Immigrants from Nepal ($52,611, a difference of 0.040%), Immigrants from the Azores ($52,621, a difference of 0.060%), and Central American ($52,626, a difference of 0.070%). Similarly, the demographic groups most similar to Immigrants from Austria are Polish ($52,407, a difference of 0.010%), Immigrants from Uganda ($52,374, a difference of 0.050%), Immigrants from Trinidad and Tobago ($52,437, a difference of 0.070%), Japanese ($52,365, a difference of 0.070%), and Immigrants from Chile ($52,440, a difference of 0.080%).
| Demographics | Rating | Rank | Householder Income Under 25 years |
| Trinidadians and Tobagonians | 74.6 /100 | #152 | Good $52,631 |
| Central Americans | 74.4 /100 | #153 | Good $52,626 |
| Immigrants | Azores | 74.2 /100 | #154 | Good $52,621 |
| Immigrants | Denmark | 73.8 /100 | #155 | Good $52,612 |
| Immigrants | Nepal | 73.7 /100 | #156 | Good $52,611 |
| Ghanaians | 72.9 /100 | #157 | Good $52,594 |
| Immigrants | Netherlands | 72.8 /100 | #158 | Good $52,592 |
| Mongolians | 70.2 /100 | #159 | Good $52,540 |
| Immigrants | Turkey | 68.3 /100 | #160 | Good $52,503 |
| Uruguayans | 66.2 /100 | #161 | Good $52,465 |
| Immigrants | Cambodia | 65.4 /100 | #162 | Good $52,450 |
| Immigrants | Chile | 64.8 /100 | #163 | Good $52,440 |
| Immigrants | Trinidad and Tobago | 64.7 /100 | #164 | Good $52,437 |
| Poles | 63.0 /100 | #165 | Good $52,407 |
| Immigrants | Austria | 62.6 /100 | #166 | Good $52,400 |
| Immigrants | Uganda | 61.1 /100 | #167 | Good $52,374 |
| Japanese | 60.5 /100 | #168 | Good $52,365 |
| Canadians | 58.8 /100 | #169 | Average $52,336 |
| Israelis | 58.8 /100 | #170 | Average $52,335 |
| Immigrants | Uruguay | 56.8 /100 | #171 | Average $52,302 |
| Cypriots | 51.2 /100 | #172 | Average $52,209 |