British West Indian vs Immigrants from Austria Householder Income Under 25 years
COMPARE
British West Indian
Immigrants from Austria
Householder Income Under 25 years
Householder Income Under 25 years Comparison
British West Indians
Immigrants from Austria
$51,844
HOUSEHOLDER INCOME UNDER 25 YEARS
30.0/ 100
METRIC RATING
177th/ 347
METRIC RANK
$52,400
HOUSEHOLDER INCOME UNDER 25 YEARS
62.6/ 100
METRIC RATING
166th/ 347
METRIC RANK
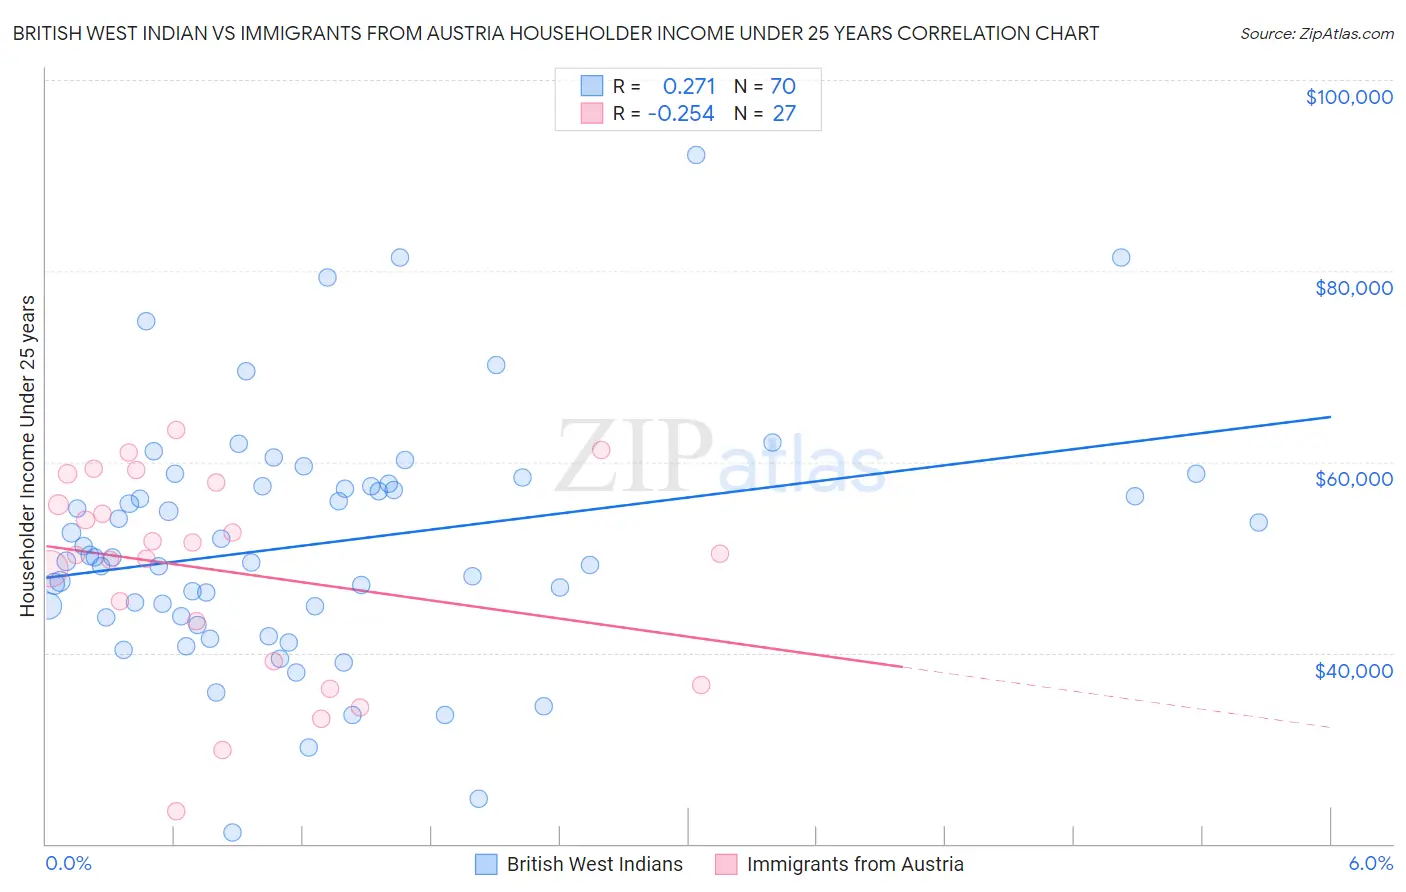
British West Indian vs Immigrants from Austria Householder Income Under 25 years Correlation Chart
The statistical analysis conducted on geographies consisting of 137,149,594 people shows a weak positive correlation between the proportion of British West Indians and household income with householder under the age of 25 in the United States with a correlation coefficient (R) of 0.271 and weighted average of $51,844. Similarly, the statistical analysis conducted on geographies consisting of 148,326,124 people shows a weak negative correlation between the proportion of Immigrants from Austria and household income with householder under the age of 25 in the United States with a correlation coefficient (R) of -0.254 and weighted average of $52,400, a difference of 1.1%.
Householder Income Under 25 years Correlation Summary
| Measurement | British West Indian | Immigrants from Austria |
| Minimum | $21,210 | $23,462 |
| Maximum | $92,155 | $63,282 |
| Range | $70,945 | $39,820 |
| Mean | $51,462 | $48,547 |
| Median | $49,982 | $50,350 |
| Interquartile 25% (IQ1) | $43,850 | $39,087 |
| Interquartile 75% (IQ3) | $57,401 | $57,875 |
| Interquartile Range (IQR) | $13,551 | $18,788 |
| Standard Deviation (Sample) | $12,774 | $10,655 |
| Standard Deviation (Population) | $12,683 | $10,456 |
Demographics Similar to British West Indians and Immigrants from Austria by Householder Income Under 25 years
In terms of householder income under 25 years, the demographic groups most similar to British West Indians are Finnish ($51,827, a difference of 0.030%), Basque ($51,818, a difference of 0.050%), Immigrants from England ($51,817, a difference of 0.050%), European ($51,796, a difference of 0.090%), and Austrian ($51,898, a difference of 0.10%). Similarly, the demographic groups most similar to Immigrants from Austria are Polish ($52,407, a difference of 0.010%), Immigrants from Uganda ($52,374, a difference of 0.050%), Immigrants from Trinidad and Tobago ($52,437, a difference of 0.070%), Japanese ($52,365, a difference of 0.070%), and Immigrants from Chile ($52,440, a difference of 0.080%).
| Demographics | Rating | Rank | Householder Income Under 25 years |
| Uruguayans | 66.2 /100 | #161 | Good $52,465 |
| Immigrants | Cambodia | 65.4 /100 | #162 | Good $52,450 |
| Immigrants | Chile | 64.8 /100 | #163 | Good $52,440 |
| Immigrants | Trinidad and Tobago | 64.7 /100 | #164 | Good $52,437 |
| Poles | 63.0 /100 | #165 | Good $52,407 |
| Immigrants | Austria | 62.6 /100 | #166 | Good $52,400 |
| Immigrants | Uganda | 61.1 /100 | #167 | Good $52,374 |
| Japanese | 60.5 /100 | #168 | Good $52,365 |
| Canadians | 58.8 /100 | #169 | Average $52,336 |
| Israelis | 58.8 /100 | #170 | Average $52,335 |
| Immigrants | Uruguay | 56.8 /100 | #171 | Average $52,302 |
| Cypriots | 51.2 /100 | #172 | Average $52,209 |
| Barbadians | 50.8 /100 | #173 | Average $52,202 |
| Immigrants | Western Asia | 50.0 /100 | #174 | Average $52,190 |
| Immigrants | Zimbabwe | 33.8 /100 | #175 | Fair $51,914 |
| Austrians | 32.9 /100 | #176 | Fair $51,898 |
| British West Indians | 30.0 /100 | #177 | Fair $51,844 |
| Finns | 29.2 /100 | #178 | Fair $51,827 |
| Basques | 28.7 /100 | #179 | Fair $51,818 |
| Immigrants | England | 28.7 /100 | #180 | Fair $51,817 |
| Europeans | 27.6 /100 | #181 | Fair $51,796 |