Bulgarian vs Ghanaian Median Household Income
COMPARE
Bulgarian
Ghanaian
Median Household Income
Median Household Income Comparison
Bulgarians
Ghanaians
$96,290
MEDIAN HOUSEHOLD INCOME
99.9/ 100
METRIC RATING
50th/ 347
METRIC RANK
$83,582
MEDIAN HOUSEHOLD INCOME
27.4/ 100
METRIC RATING
194th/ 347
METRIC RANK
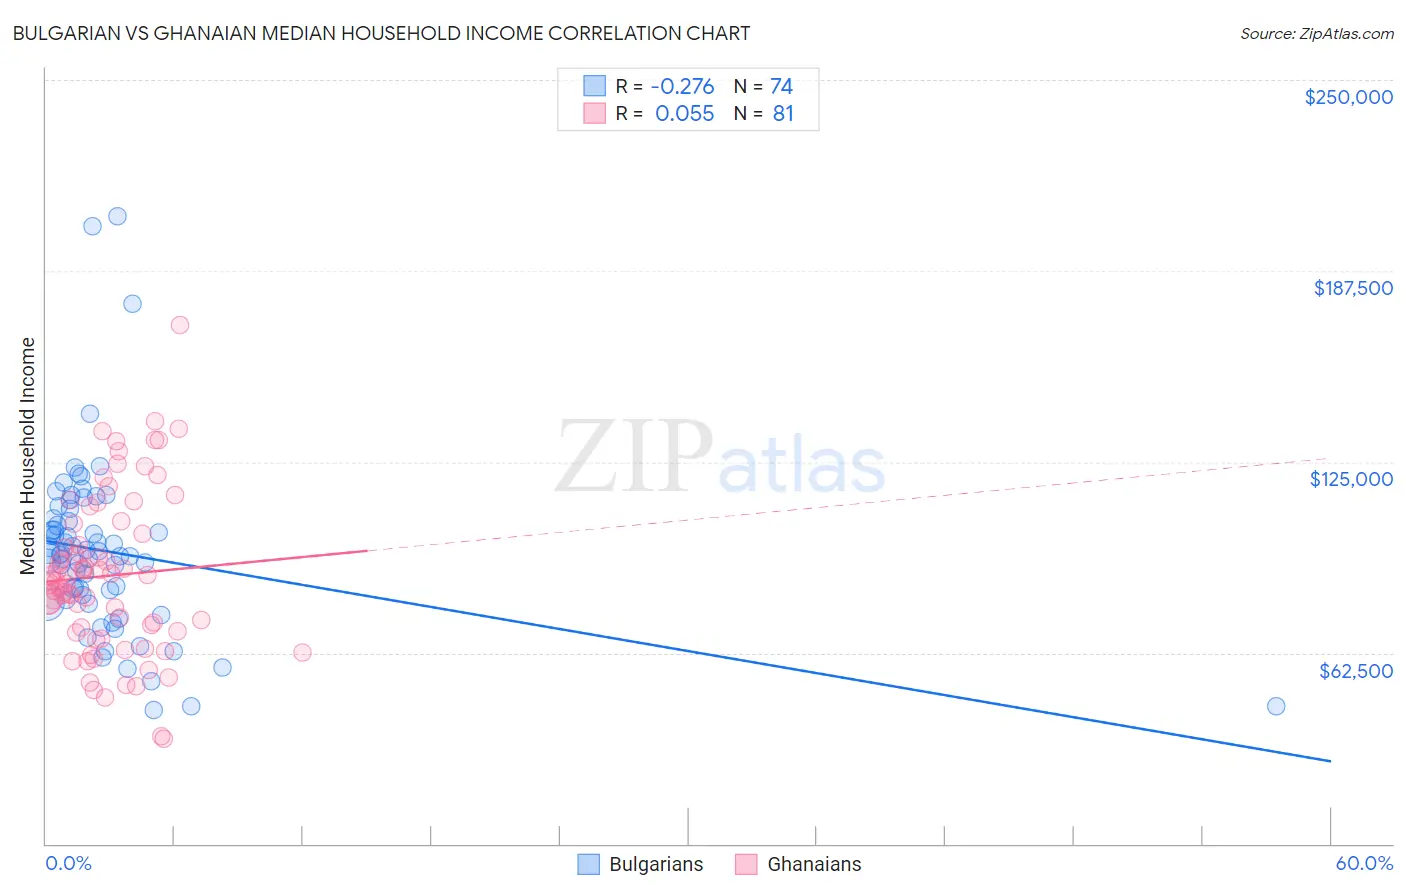
Bulgarian vs Ghanaian Median Household Income Correlation Chart
The statistical analysis conducted on geographies consisting of 205,543,372 people shows a weak negative correlation between the proportion of Bulgarians and median household income in the United States with a correlation coefficient (R) of -0.276 and weighted average of $96,290. Similarly, the statistical analysis conducted on geographies consisting of 190,498,021 people shows a slight positive correlation between the proportion of Ghanaians and median household income in the United States with a correlation coefficient (R) of 0.055 and weighted average of $83,582, a difference of 15.2%.
Median Household Income Correlation Summary
| Measurement | Bulgarian | Ghanaian |
| Minimum | $43,716 | $34,375 |
| Maximum | $205,412 | $169,773 |
| Range | $161,696 | $135,398 |
| Mean | $95,604 | $87,698 |
| Median | $94,643 | $86,122 |
| Interquartile 25% (IQ1) | $79,613 | $69,414 |
| Interquartile 75% (IQ3) | $106,436 | $103,226 |
| Interquartile Range (IQR) | $26,823 | $33,812 |
| Standard Deviation (Sample) | $28,917 | $26,089 |
| Standard Deviation (Population) | $28,721 | $25,928 |
Similar Demographics by Median Household Income
Demographics Similar to Bulgarians by Median Household Income
In terms of median household income, the demographic groups most similar to Bulgarians are Immigrants from Malaysia ($96,292, a difference of 0.0%), Cambodian ($96,324, a difference of 0.040%), Immigrants from Russia ($96,378, a difference of 0.090%), Australian ($96,490, a difference of 0.21%), and Israeli ($96,552, a difference of 0.27%).
| Demographics | Rating | Rank | Median Household Income |
| Immigrants | France | 99.9 /100 | #43 | Exceptional $96,743 |
| Immigrants | Greece | 99.9 /100 | #44 | Exceptional $96,675 |
| Israelis | 99.9 /100 | #45 | Exceptional $96,552 |
| Australians | 99.9 /100 | #46 | Exceptional $96,490 |
| Immigrants | Russia | 99.9 /100 | #47 | Exceptional $96,378 |
| Cambodians | 99.9 /100 | #48 | Exceptional $96,324 |
| Immigrants | Malaysia | 99.9 /100 | #49 | Exceptional $96,292 |
| Bulgarians | 99.9 /100 | #50 | Exceptional $96,290 |
| Estonians | 99.9 /100 | #51 | Exceptional $95,930 |
| Immigrants | South Africa | 99.9 /100 | #52 | Exceptional $95,800 |
| Paraguayans | 99.9 /100 | #53 | Exceptional $95,737 |
| Egyptians | 99.9 /100 | #54 | Exceptional $95,673 |
| Immigrants | Czechoslovakia | 99.9 /100 | #55 | Exceptional $95,319 |
| Immigrants | Austria | 99.9 /100 | #56 | Exceptional $95,277 |
| New Zealanders | 99.8 /100 | #57 | Exceptional $95,146 |
Demographics Similar to Ghanaians by Median Household Income
In terms of median household income, the demographic groups most similar to Ghanaians are Finnish ($83,607, a difference of 0.030%), Immigrants from Armenia ($83,555, a difference of 0.030%), Welsh ($83,628, a difference of 0.060%), French ($83,468, a difference of 0.14%), and Aleut ($83,446, a difference of 0.16%).
| Demographics | Rating | Rank | Median Household Income |
| Belgians | 33.2 /100 | #187 | Fair $84,008 |
| Tlingit-Haida | 32.6 /100 | #188 | Fair $83,968 |
| Immigrants | Colombia | 31.7 /100 | #189 | Fair $83,902 |
| Slovaks | 30.2 /100 | #190 | Fair $83,798 |
| Iraqis | 29.6 /100 | #191 | Fair $83,753 |
| Welsh | 28.0 /100 | #192 | Fair $83,628 |
| Finns | 27.7 /100 | #193 | Fair $83,607 |
| Ghanaians | 27.4 /100 | #194 | Fair $83,582 |
| Immigrants | Armenia | 27.0 /100 | #195 | Fair $83,555 |
| French | 26.0 /100 | #196 | Fair $83,468 |
| Aleuts | 25.7 /100 | #197 | Fair $83,446 |
| Japanese | 25.1 /100 | #198 | Fair $83,395 |
| Germans | 24.6 /100 | #199 | Fair $83,358 |
| Tsimshian | 24.5 /100 | #200 | Fair $83,346 |
| Spanish | 24.4 /100 | #201 | Fair $83,343 |