Immigrants from Saudi Arabia vs Ghanaian Median Household Income
COMPARE
Immigrants from Saudi Arabia
Ghanaian
Median Household Income
Median Household Income Comparison
Immigrants from Saudi Arabia
Ghanaians
$86,875
MEDIAN HOUSEHOLD INCOME
75.8/ 100
METRIC RATING
152nd/ 347
METRIC RANK
$83,582
MEDIAN HOUSEHOLD INCOME
27.4/ 100
METRIC RATING
194th/ 347
METRIC RANK
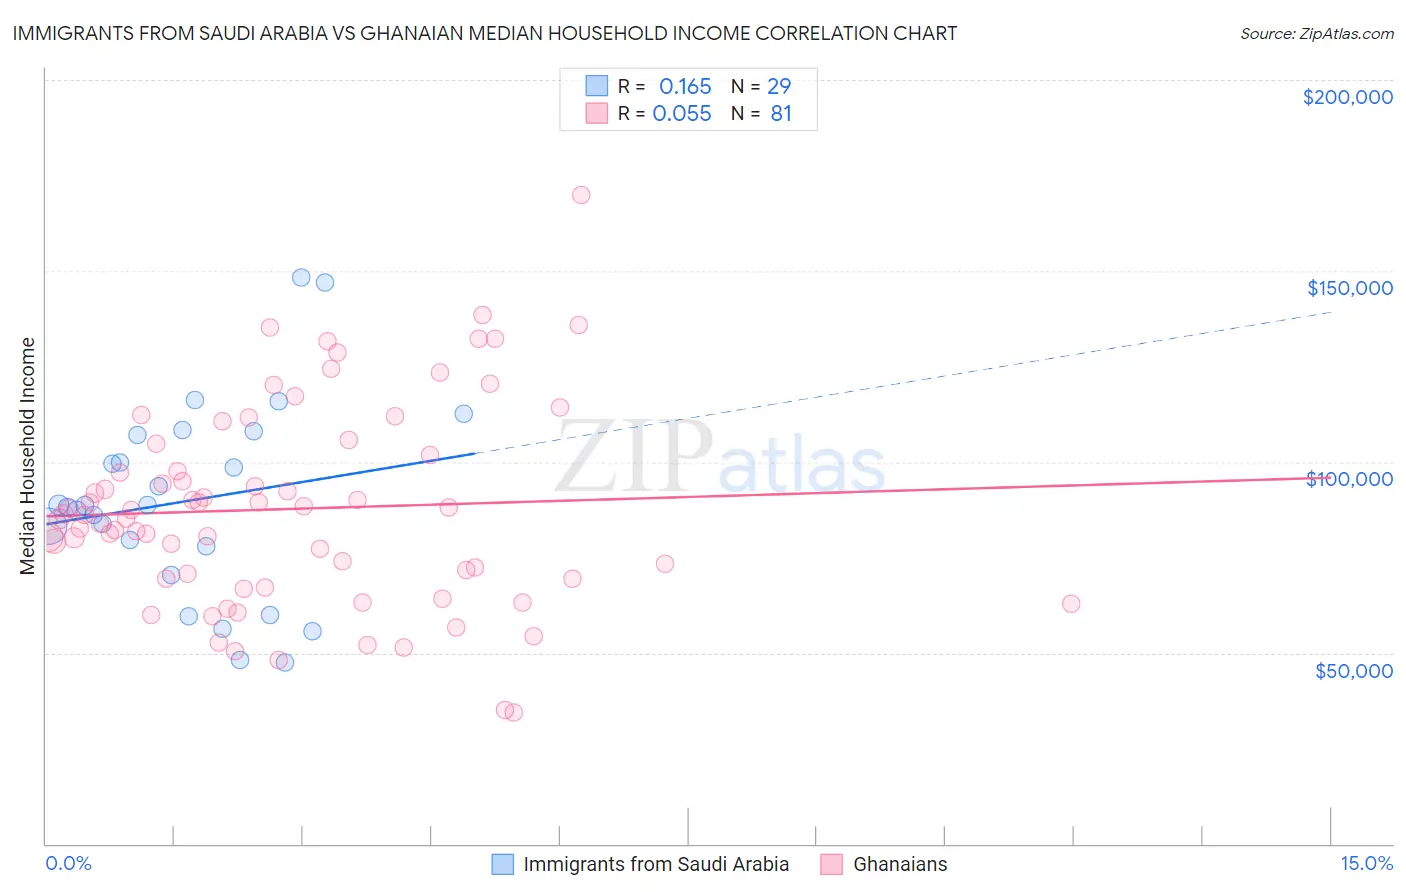
Immigrants from Saudi Arabia vs Ghanaian Median Household Income Correlation Chart
The statistical analysis conducted on geographies consisting of 164,184,047 people shows a poor positive correlation between the proportion of Immigrants from Saudi Arabia and median household income in the United States with a correlation coefficient (R) of 0.165 and weighted average of $86,875. Similarly, the statistical analysis conducted on geographies consisting of 190,498,021 people shows a slight positive correlation between the proportion of Ghanaians and median household income in the United States with a correlation coefficient (R) of 0.055 and weighted average of $83,582, a difference of 3.9%.
Median Household Income Correlation Summary
| Measurement | Immigrants from Saudi Arabia | Ghanaian |
| Minimum | $47,501 | $34,375 |
| Maximum | $148,227 | $169,773 |
| Range | $100,726 | $135,398 |
| Mean | $89,831 | $87,698 |
| Median | $88,579 | $86,122 |
| Interquartile 25% (IQ1) | $74,250 | $69,414 |
| Interquartile 75% (IQ3) | $107,595 | $103,226 |
| Interquartile Range (IQR) | $33,345 | $33,812 |
| Standard Deviation (Sample) | $25,493 | $26,089 |
| Standard Deviation (Population) | $25,050 | $25,928 |
Similar Demographics by Median Household Income
Demographics Similar to Immigrants from Saudi Arabia by Median Household Income
In terms of median household income, the demographic groups most similar to Immigrants from Saudi Arabia are Hungarian ($86,920, a difference of 0.050%), South American ($86,824, a difference of 0.060%), Immigrants from Germany ($86,764, a difference of 0.13%), Basque ($87,001, a difference of 0.15%), and Immigrants from Nepal ($87,046, a difference of 0.20%).
| Demographics | Rating | Rank | Median Household Income |
| Ugandans | 82.9 /100 | #145 | Excellent $87,557 |
| Immigrants | Uganda | 82.8 /100 | #146 | Excellent $87,553 |
| South American Indians | 81.8 /100 | #147 | Excellent $87,446 |
| Costa Ricans | 80.0 /100 | #148 | Excellent $87,262 |
| Immigrants | Nepal | 77.7 /100 | #149 | Good $87,046 |
| Basques | 77.2 /100 | #150 | Good $87,001 |
| Hungarians | 76.3 /100 | #151 | Good $86,920 |
| Immigrants | Saudi Arabia | 75.8 /100 | #152 | Good $86,875 |
| South Americans | 75.1 /100 | #153 | Good $86,824 |
| Immigrants | Germany | 74.4 /100 | #154 | Good $86,764 |
| Carpatho Rusyns | 72.8 /100 | #155 | Good $86,635 |
| Immigrants | Albania | 71.5 /100 | #156 | Good $86,534 |
| Samoans | 71.0 /100 | #157 | Good $86,498 |
| Moroccans | 70.6 /100 | #158 | Good $86,468 |
| Immigrants | Uzbekistan | 70.1 /100 | #159 | Good $86,425 |
Demographics Similar to Ghanaians by Median Household Income
In terms of median household income, the demographic groups most similar to Ghanaians are Finnish ($83,607, a difference of 0.030%), Immigrants from Armenia ($83,555, a difference of 0.030%), Welsh ($83,628, a difference of 0.060%), French ($83,468, a difference of 0.14%), and Aleut ($83,446, a difference of 0.16%).
| Demographics | Rating | Rank | Median Household Income |
| Belgians | 33.2 /100 | #187 | Fair $84,008 |
| Tlingit-Haida | 32.6 /100 | #188 | Fair $83,968 |
| Immigrants | Colombia | 31.7 /100 | #189 | Fair $83,902 |
| Slovaks | 30.2 /100 | #190 | Fair $83,798 |
| Iraqis | 29.6 /100 | #191 | Fair $83,753 |
| Welsh | 28.0 /100 | #192 | Fair $83,628 |
| Finns | 27.7 /100 | #193 | Fair $83,607 |
| Ghanaians | 27.4 /100 | #194 | Fair $83,582 |
| Immigrants | Armenia | 27.0 /100 | #195 | Fair $83,555 |
| French | 26.0 /100 | #196 | Fair $83,468 |
| Aleuts | 25.7 /100 | #197 | Fair $83,446 |
| Japanese | 25.1 /100 | #198 | Fair $83,395 |
| Germans | 24.6 /100 | #199 | Fair $83,358 |
| Tsimshian | 24.5 /100 | #200 | Fair $83,346 |
| Spanish | 24.4 /100 | #201 | Fair $83,343 |