Nepalese vs Ghanaian Median Household Income
COMPARE
Nepalese
Ghanaian
Median Household Income
Median Household Income Comparison
Nepalese
Ghanaians
$82,410
MEDIAN HOUSEHOLD INCOME
15.1/ 100
METRIC RATING
213th/ 347
METRIC RANK
$83,582
MEDIAN HOUSEHOLD INCOME
27.4/ 100
METRIC RATING
194th/ 347
METRIC RANK
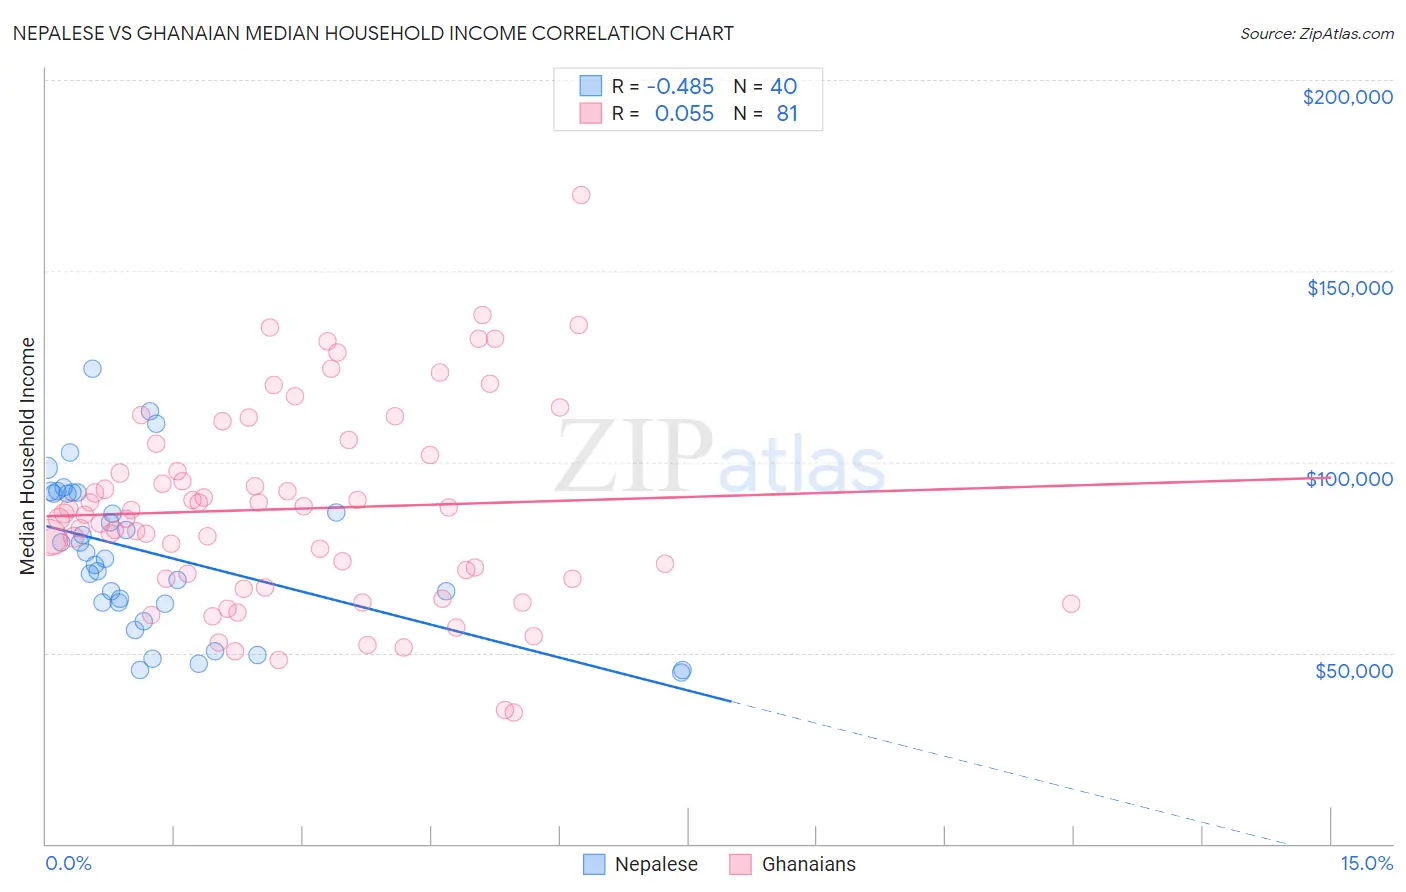
Nepalese vs Ghanaian Median Household Income Correlation Chart
The statistical analysis conducted on geographies consisting of 24,521,755 people shows a moderate negative correlation between the proportion of Nepalese and median household income in the United States with a correlation coefficient (R) of -0.485 and weighted average of $82,410. Similarly, the statistical analysis conducted on geographies consisting of 190,498,021 people shows a slight positive correlation between the proportion of Ghanaians and median household income in the United States with a correlation coefficient (R) of 0.055 and weighted average of $83,582, a difference of 1.4%.
Median Household Income Correlation Summary
| Measurement | Nepalese | Ghanaian |
| Minimum | $45,000 | $34,375 |
| Maximum | $124,273 | $169,773 |
| Range | $79,273 | $135,398 |
| Mean | $75,935 | $87,698 |
| Median | $75,316 | $86,122 |
| Interquartile 25% (IQ1) | $63,001 | $69,414 |
| Interquartile 75% (IQ3) | $91,848 | $103,226 |
| Interquartile Range (IQR) | $28,847 | $33,812 |
| Standard Deviation (Sample) | $20,077 | $26,089 |
| Standard Deviation (Population) | $19,825 | $25,928 |
Demographics Similar to Nepalese and Ghanaians by Median Household Income
In terms of median household income, the demographic groups most similar to Nepalese are Venezuelan ($82,432, a difference of 0.030%), Salvadoran ($82,449, a difference of 0.050%), Immigrants from Uruguay ($82,560, a difference of 0.18%), Immigrants from Iraq ($82,594, a difference of 0.22%), and French Canadian ($82,810, a difference of 0.49%). Similarly, the demographic groups most similar to Ghanaians are Finnish ($83,607, a difference of 0.030%), Immigrants from Armenia ($83,555, a difference of 0.030%), French ($83,468, a difference of 0.14%), Aleut ($83,446, a difference of 0.16%), and Japanese ($83,395, a difference of 0.22%).
| Demographics | Rating | Rank | Median Household Income |
| Finns | 27.7 /100 | #193 | Fair $83,607 |
| Ghanaians | 27.4 /100 | #194 | Fair $83,582 |
| Immigrants | Armenia | 27.0 /100 | #195 | Fair $83,555 |
| French | 26.0 /100 | #196 | Fair $83,468 |
| Aleuts | 25.7 /100 | #197 | Fair $83,446 |
| Japanese | 25.1 /100 | #198 | Fair $83,395 |
| Germans | 24.6 /100 | #199 | Fair $83,358 |
| Tsimshian | 24.5 /100 | #200 | Fair $83,346 |
| Spanish | 24.4 /100 | #201 | Fair $83,343 |
| Immigrants | Thailand | 24.3 /100 | #202 | Fair $83,327 |
| Immigrants | Cambodia | 24.0 /100 | #203 | Fair $83,304 |
| Immigrants | Africa | 23.8 /100 | #204 | Fair $83,289 |
| Celtics | 22.7 /100 | #205 | Fair $83,193 |
| Immigrants | Kenya | 21.3 /100 | #206 | Fair $83,068 |
| Dutch | 20.3 /100 | #207 | Fair $82,971 |
| French Canadians | 18.7 /100 | #208 | Poor $82,810 |
| Immigrants | Iraq | 16.7 /100 | #209 | Poor $82,594 |
| Immigrants | Uruguay | 16.4 /100 | #210 | Poor $82,560 |
| Salvadorans | 15.4 /100 | #211 | Poor $82,449 |
| Venezuelans | 15.3 /100 | #212 | Poor $82,432 |
| Nepalese | 15.1 /100 | #213 | Poor $82,410 |