Lithuanian vs Immigrants from Vietnam Median Household Income

COMPARE

Lithuanian
Race
Ancestry
AfghanAfricanAlaska NativeAlaskan AthabascanAlbanianAleutAlsatianAmericanApacheArabArapahoArgentineanArmenianAssyrian/Chaldean/SyriacAustralianAustrianBahamianBangladeshiBarbadianBasqueBelgianBelizeanBermudanBhutaneseBlackfeetBolivianBrazilianBritishBritish West IndianBulgarianBurmeseCajunCambodianCanadianCape VerdeanCarpatho RusynCelticCentral AmericanCentral American IndianCherokeeCheyenneChickasawChileanChineseChippewaChoctawColombianColvilleComancheCosta RicanCreeCreekCroatianCrowCubanCypriotCzechCzechoslovakianDanishDelawareDominicanDutchDutch West IndianEastern EuropeanEcuadorianEgyptianEnglishEstonianEthiopianEuropeanFijianFilipinoFinnishFrenchFrench American IndianFrench CanadianGermanGerman RussianGhanaianGreekGuamanian/ChamorroGuatemalanGuyaneseHaitianHmongHonduranHopiHoumaHungarianIcelanderIndian (Asian)IndonesianInupiatIranianIraqiIrishIroquoisIsraeliItalianJamaicanJapaneseJordanianKenyanKiowaKoreanLaotianLatvianLebaneseLiberianLithuanianLumbeeLuxembourgerMacedonianMalaysianMalteseMarshalleseMenomineeMexicanMexican American IndianMongolianMoroccanNative HawaiianNavajoNepaleseNew ZealanderNicaraguanNigerianNorthern EuropeanNorwegianOkinawanOsageOttawaPaiutePakistaniPalestinianPanamanianParaguayanPennsylvania GermanPeruvianPimaPolishPortuguesePotawatomiPuebloPuerto RicanPuget Sound SalishRomanianRussianSalvadoranSamoanScandinavianScotch-IrishScottishSeminoleSenegaleseSerbianShoshoneSierra LeoneanSiouxSlavicSlovakSloveneSomaliSouth AfricanSouth AmericanSouth American IndianSoviet UnionSpaniardSpanishSpanish AmericanSpanish American IndianSri LankanSubsaharan AfricanSudaneseSwedishSwissSyrianTaiwaneseThaiTlingit-HaidaTohono O'OdhamTonganTrinidadian and TobagonianTsimshianTurkishU.S. Virgin IslanderUgandanUkrainianUruguayanUteVenezuelanVietnameseWelshWest IndianYakamaYaquiYugoslavianYumanYup'ikZimbabwean
Immigration
NonimmigrantsImmigrantsAfghanistanAfricaAlbaniaArgentinaArmeniaAsiaAustraliaAustriaBahamasBangladeshBarbadosBelarusBelgiumBelizeBoliviaBosnia and HerzegovinaBrazilBulgariaBurma/MyanmarCabo VerdeCambodiaCameroonCanadaCaribbeanCentral AmericaChileChinaColombiaCongoCosta RicaCroatiaCubaCzechoslovakiaDenmarkDominicaDominican RepublicEastern AfricaEastern AsiaEastern EuropeEcuadorEgyptEl SalvadorEnglandEritreaEthiopiaEuropeFijiFranceGermanyGhanaGreeceGrenadaGuatemalaGuyanaHaitiHondurasHong KongHungaryIndiaIndonesiaIranIraqIrelandIsraelItalyJamaicaJapanJordanKazakhstanKenyaKoreaKuwaitLaosLatin AmericaLatviaLebanonLiberiaLithuaniaMalaysiaMexicoMicronesiaMiddle AfricaMoldovaMoroccoNepalNetherlandsNicaraguaNigeriaNorth AmericaNorth MacedoniaNorthern AfricaNorthern EuropeNorwayOceaniaPakistanPanamaPeruPhilippinesPolandPortugalRomaniaRussiaSaudi ArabiaScotlandSenegalSerbiaSierra LeoneSingaporeSomaliaSouth AfricaSouth AmericaSouth Central AsiaSouth Eastern AsiaSouthern EuropeSpainSri LankaSt. Vincent and the GrenadinesSudanSwedenSwitzerlandSyriaTaiwanThailandTrinidad and TobagoTurkeyUgandaUkraineUruguayUzbekistanVenezuelaWest IndiesWestern AfricaWestern AsiaWestern EuropeYemenZaireZimbabweAzores
Immigrants from Vietnam
Race
Ancestry
AfghanAfricanAlaska NativeAlaskan AthabascanAlbanianAleutAlsatianAmericanApacheArabArapahoArgentineanArmenianAssyrian/Chaldean/SyriacAustralianAustrianBahamianBangladeshiBarbadianBasqueBelgianBelizeanBermudanBhutaneseBlackfeetBolivianBrazilianBritishBritish West IndianBulgarianBurmeseCajunCambodianCanadianCape VerdeanCarpatho RusynCelticCentral AmericanCentral American IndianCherokeeCheyenneChickasawChileanChineseChippewaChoctawColombianColvilleComancheCosta RicanCreeCreekCroatianCrowCubanCypriotCzechCzechoslovakianDanishDelawareDominicanDutchDutch West IndianEastern EuropeanEcuadorianEgyptianEnglishEstonianEthiopianEuropeanFijianFilipinoFinnishFrenchFrench American IndianFrench CanadianGermanGerman RussianGhanaianGreekGuamanian/ChamorroGuatemalanGuyaneseHaitianHmongHonduranHopiHoumaHungarianIcelanderIndian (Asian)IndonesianInupiatIranianIraqiIrishIroquoisIsraeliItalianJamaicanJapaneseJordanianKenyanKiowaKoreanLaotianLatvianLebaneseLiberianLumbeeLuxembourgerMacedonianMalaysianMalteseMarshalleseMenomineeMexicanMexican American IndianMongolianMoroccanNative HawaiianNavajoNepaleseNew ZealanderNicaraguanNigerianNorthern EuropeanNorwegianOkinawanOsageOttawaPaiutePakistaniPalestinianPanamanianParaguayanPennsylvania GermanPeruvianPimaPolishPortuguesePotawatomiPuebloPuerto RicanPuget Sound SalishRomanianRussianSalvadoranSamoanScandinavianScotch-IrishScottishSeminoleSenegaleseSerbianShoshoneSierra LeoneanSiouxSlavicSlovakSloveneSomaliSouth AfricanSouth AmericanSouth American IndianSoviet UnionSpaniardSpanishSpanish AmericanSpanish American IndianSri LankanSubsaharan AfricanSudaneseSwedishSwissSyrianTaiwaneseThaiTlingit-HaidaTohono O'OdhamTonganTrinidadian and TobagonianTsimshianTurkishU.S. Virgin IslanderUgandanUkrainianUruguayanUteVenezuelanVietnameseWelshWest IndianYakamaYaquiYugoslavianYumanYup'ikZimbabwean
Immigration
NonimmigrantsImmigrantsAfghanistanAfricaAlbaniaArgentinaArmeniaAsiaAustraliaAustriaBahamasBangladeshBarbadosBelarusBelgiumBelizeBoliviaBosnia and HerzegovinaBrazilBulgariaBurma/MyanmarCabo VerdeCambodiaCameroonCanadaCaribbeanCentral AmericaChileChinaColombiaCongoCosta RicaCroatiaCubaCzechoslovakiaDenmarkDominicaDominican RepublicEastern AfricaEastern AsiaEastern EuropeEcuadorEgyptEl SalvadorEnglandEritreaEthiopiaEuropeFijiFranceGermanyGhanaGreeceGrenadaGuatemalaGuyanaHaitiHondurasHong KongHungaryIndiaIndonesiaIranIraqIrelandIsraelItalyJamaicaJapanJordanKazakhstanKenyaKoreaKuwaitLaosLatin AmericaLatviaLebanonLiberiaLithuaniaMalaysiaMexicoMicronesiaMiddle AfricaMoldovaMoroccoNepalNetherlandsNicaraguaNigeriaNorth AmericaNorth MacedoniaNorthern AfricaNorthern EuropeNorwayOceaniaPakistanPanamaPeruPhilippinesPolandPortugalRomaniaRussiaSaudi ArabiaScotlandSenegalSerbiaSierra LeoneSingaporeSomaliaSouth AfricaSouth AmericaSouth Central AsiaSouth Eastern AsiaSouthern EuropeSpainSri LankaSt. Vincent and the GrenadinesSudanSwedenSwitzerlandSyriaTaiwanThailandTrinidad and TobagoTurkeyUgandaUkraineUruguayUzbekistanVenezuelaVietnamWest IndiesWestern AfricaWestern AsiaWestern EuropeYemenZaireZimbabweAzores
Median Household Income
Income
Poverty
Unemployment
Labor Participation
Family Structure
Vehicle Availability
Education Level
Disability

Median Household Income Comparison

Lithuanians

Immigrants from Vietnam

Exceptional
Exceptional
$93,852
MEDIAN HOUSEHOLD INCOME
99.6/ 100
METRIC RATING
72nd/ 347
METRIC RANK
$91,987
MEDIAN HOUSEHOLD INCOME
98.8/ 100
METRIC RATING
91st/ 347
METRIC RANK

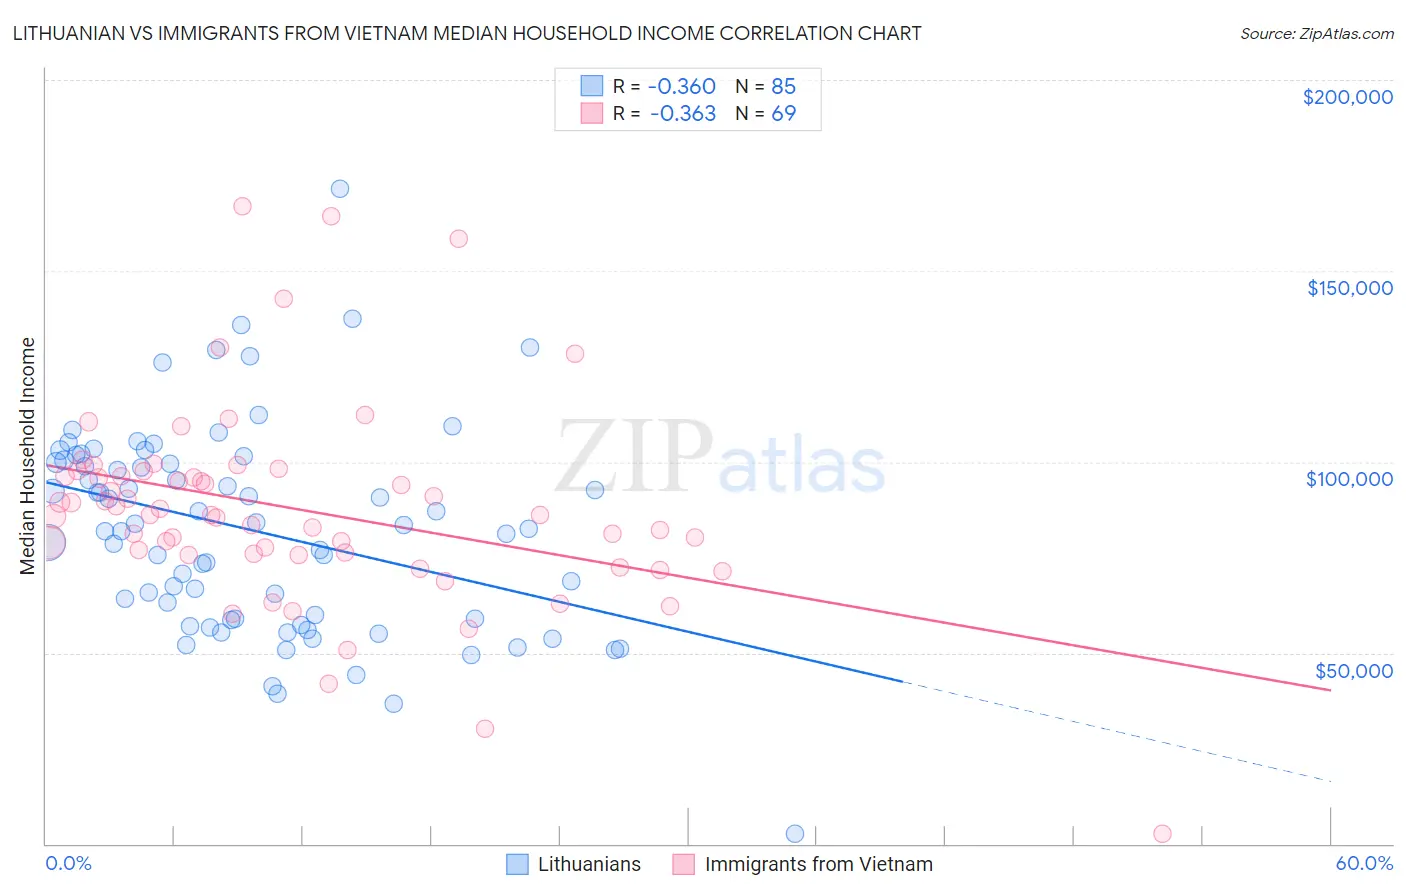
Lithuanian vs Immigrants from Vietnam Median Household Income Correlation Chart

The statistical analysis conducted on geographies consisting of 421,640,790 people shows a mild negative correlation between the proportion of Lithuanians and median household income in the United States with a correlation coefficient (R) of -0.360 and weighted average of $93,852. Similarly, the statistical analysis conducted on geographies consisting of 404,446,933 people shows a mild negative correlation between the proportion of Immigrants from Vietnam and median household income in the United States with a correlation coefficient (R) of -0.363 and weighted average of $91,987, a difference of 2.0%.
Lithuanian vs Immigrants from Vietnam Median Household Income

Median Household Income Correlation Summary

MeasurementLithuanianImmigrants from Vietnam
Minimum$2,499$2,499
Maximum$171,528$166,850
Range$169,029$164,351
Mean$81,905$87,664
Median$82,500$86,139
Interquartile 25% (IQ1)$58,701$75,826
Interquartile 75% (IQ3)$100,159$96,947
Interquartile Range (IQR)$41,458$21,121
Standard Deviation (Sample)$27,290$26,629
Standard Deviation (Population)$27,129$26,435

Demographics Similar to Lithuanians and Immigrants from Vietnam by Median Household Income

In terms of median household income, the demographic groups most similar to Lithuanians are Immigrants from Philippines ($93,899, a difference of 0.050%), Immigrants from Egypt ($93,700, a difference of 0.16%), Immigrants from Latvia ($93,602, a difference of 0.27%), Immigrants from Italy ($93,465, a difference of 0.41%), and South African ($93,379, a difference of 0.51%). Similarly, the demographic groups most similar to Immigrants from Vietnam are Assyrian/Chaldean/Syriac ($91,991, a difference of 0.0%), Romanian ($91,994, a difference of 0.010%), Immigrants from Canada ($92,029, a difference of 0.050%), Immigrants from England ($92,098, a difference of 0.12%), and Immigrants from Hungary ($92,094, a difference of 0.12%).
DemographicsRating | RankMedian Household Income
Immigrants | Philippines
99.6
/100
|
#71
Exceptional
$93,899
Lithuanians
99.6
/100
|
#72
Exceptional
$93,852
Immigrants | Egypt
99.6
/100
|
#73
Exceptional
$93,700
Immigrants | Latvia
99.6
/100
|
#74
Exceptional
$93,602
Immigrants | Italy
99.5
/100
|
#75
Exceptional
$93,465
South Africans
99.5
/100
|
#76
Exceptional
$93,379
Immigrants | Afghanistan
99.5
/100
|
#77
Exceptional
$93,375
Immigrants | Bulgaria
99.4
/100
|
#78
Exceptional
$93,148
Sri Lankans
99.4
/100
|
#79
Exceptional
$93,093
Tongans
99.4
/100
|
#80
Exceptional
$93,076
Immigrants | Eastern Europe
99.4
/100
|
#81
Exceptional
$93,051
Immigrants | Spain
99.3
/100
|
#82
Exceptional
$92,732
Italians
99.1
/100
|
#83
Exceptional
$92,475
Immigrants | Argentina
99.1
/100
|
#84
Exceptional
$92,417
Immigrants | Croatia
99.0
/100
|
#85
Exceptional
$92,225
Immigrants | England
98.9
/100
|
#86
Exceptional
$92,098
Immigrants | Hungary
98.9
/100
|
#87
Exceptional
$92,094
Immigrants | Canada
98.8
/100
|
#88
Exceptional
$92,029
Romanians
98.8
/100
|
#89
Exceptional
$91,994
Assyrians/Chaldeans/Syriacs
98.8
/100
|
#90
Exceptional
$91,991
Immigrants | Vietnam
98.8
/100
|
#91
Exceptional
$91,987