Liberian vs Polish Median Female Earnings
COMPARE
Liberian
Polish
Median Female Earnings
Median Female Earnings Comparison
Liberians
Poles
$38,215
MEDIAN FEMALE EARNINGS
4.4/ 100
METRIC RATING
236th/ 347
METRIC RANK
$40,371
MEDIAN FEMALE EARNINGS
80.2/ 100
METRIC RATING
148th/ 347
METRIC RANK
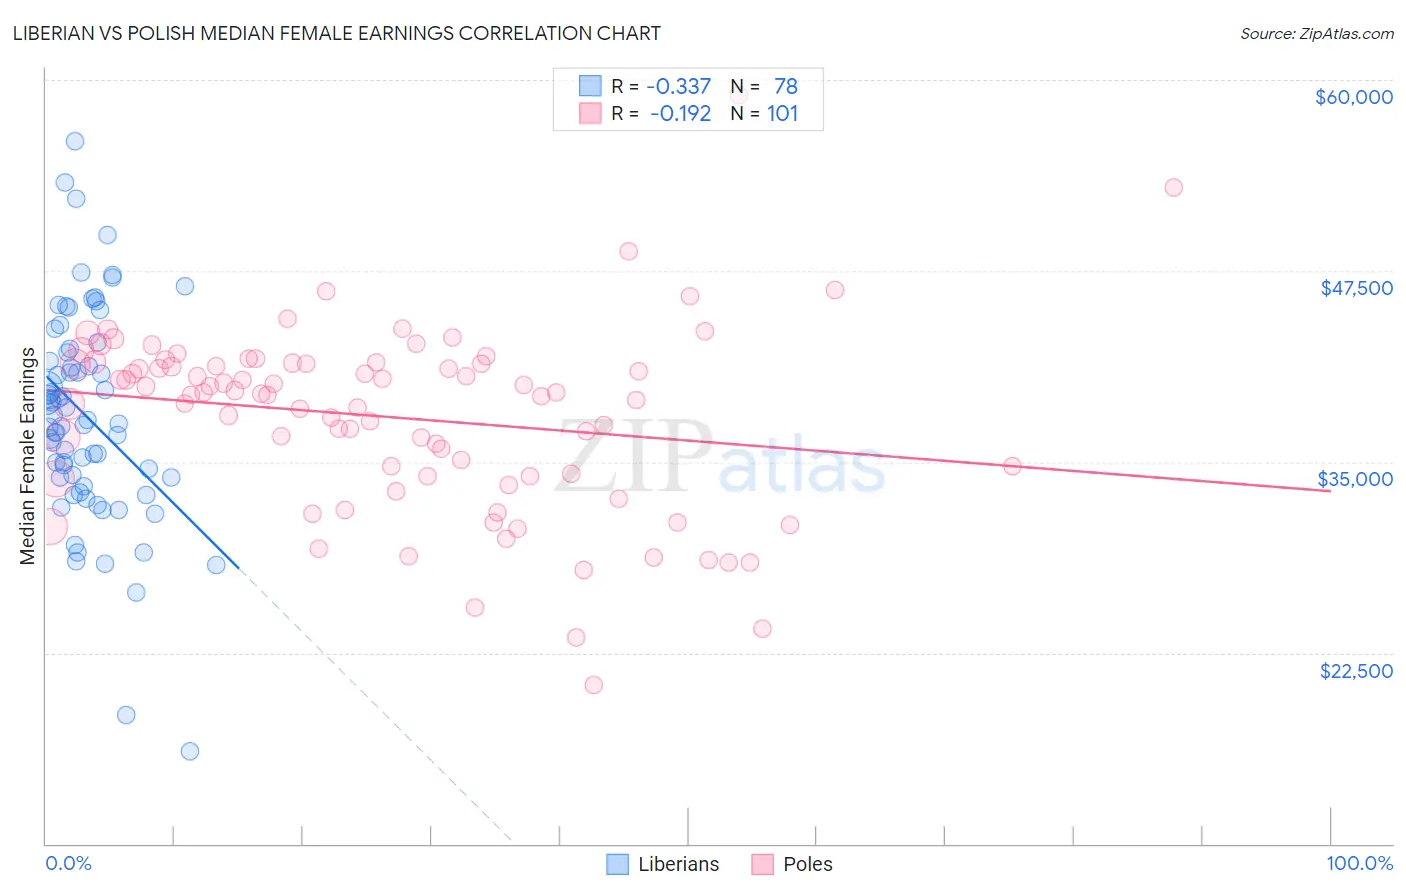
Liberian vs Polish Median Female Earnings Correlation Chart
The statistical analysis conducted on geographies consisting of 118,095,616 people shows a mild negative correlation between the proportion of Liberians and median female earnings in the United States with a correlation coefficient (R) of -0.337 and weighted average of $38,215. Similarly, the statistical analysis conducted on geographies consisting of 559,155,660 people shows a poor negative correlation between the proportion of Poles and median female earnings in the United States with a correlation coefficient (R) of -0.192 and weighted average of $40,371, a difference of 5.6%.
Median Female Earnings Correlation Summary
| Measurement | Liberian | Polish |
| Minimum | $16,076 | $20,398 |
| Maximum | $56,012 | $59,044 |
| Range | $39,936 | $38,646 |
| Mean | $37,973 | $37,935 |
| Median | $37,624 | $39,430 |
| Interquartile 25% (IQ1) | $33,939 | $34,072 |
| Interquartile 75% (IQ3) | $42,173 | $41,456 |
| Interquartile Range (IQR) | $8,234 | $7,385 |
| Standard Deviation (Sample) | $6,991 | $6,072 |
| Standard Deviation (Population) | $6,946 | $6,042 |
Similar Demographics by Median Female Earnings
Demographics Similar to Liberians by Median Female Earnings
In terms of median female earnings, the demographic groups most similar to Liberians are Sudanese ($38,215, a difference of 0.0%), Immigrants from Cabo Verde ($38,208, a difference of 0.020%), Alaska Native ($38,202, a difference of 0.030%), English ($38,196, a difference of 0.050%), and Finnish ($38,173, a difference of 0.11%).
| Demographics | Rating | Rank | Median Female Earnings |
| Belgians | 6.1 /100 | #229 | Tragic $38,382 |
| Basques | 5.7 /100 | #230 | Tragic $38,352 |
| Somalis | 5.5 /100 | #231 | Tragic $38,333 |
| Scandinavians | 5.2 /100 | #232 | Tragic $38,306 |
| Tongans | 5.1 /100 | #233 | Tragic $38,288 |
| Celtics | 5.0 /100 | #234 | Tragic $38,283 |
| Sudanese | 4.4 /100 | #235 | Tragic $38,215 |
| Liberians | 4.4 /100 | #236 | Tragic $38,215 |
| Immigrants | Cabo Verde | 4.3 /100 | #237 | Tragic $38,208 |
| Alaska Natives | 4.3 /100 | #238 | Tragic $38,202 |
| English | 4.2 /100 | #239 | Tragic $38,196 |
| Finns | 4.0 /100 | #240 | Tragic $38,173 |
| Spanish | 3.5 /100 | #241 | Tragic $38,098 |
| Immigrants | Burma/Myanmar | 3.0 /100 | #242 | Tragic $38,028 |
| Germans | 2.8 /100 | #243 | Tragic $37,986 |
Demographics Similar to Poles by Median Female Earnings
In terms of median female earnings, the demographic groups most similar to Poles are Vietnamese ($40,377, a difference of 0.020%), Immigrants from Cameroon ($40,354, a difference of 0.040%), Immigrants from Chile ($40,353, a difference of 0.040%), Immigrants from Armenia ($40,340, a difference of 0.080%), and West Indian ($40,317, a difference of 0.13%).
| Demographics | Rating | Rank | Median Female Earnings |
| Immigrants | Syria | 84.1 /100 | #141 | Excellent $40,499 |
| Sri Lankans | 84.0 /100 | #142 | Excellent $40,496 |
| Northern Europeans | 83.9 /100 | #143 | Excellent $40,491 |
| Immigrants | North Macedonia | 83.8 /100 | #144 | Excellent $40,488 |
| Brazilians | 83.6 /100 | #145 | Excellent $40,483 |
| Ghanaians | 82.1 /100 | #146 | Excellent $40,429 |
| Vietnamese | 80.4 /100 | #147 | Excellent $40,377 |
| Poles | 80.2 /100 | #148 | Excellent $40,371 |
| Immigrants | Cameroon | 79.7 /100 | #149 | Good $40,354 |
| Immigrants | Chile | 79.6 /100 | #150 | Good $40,353 |
| Immigrants | Armenia | 79.2 /100 | #151 | Good $40,340 |
| West Indians | 78.4 /100 | #152 | Good $40,317 |
| British West Indians | 77.7 /100 | #153 | Good $40,299 |
| Immigrants | Oceania | 77.6 /100 | #154 | Good $40,297 |
| Immigrants | Africa | 76.2 /100 | #155 | Good $40,257 |