Liberian vs Paiute Per Capita Income
COMPARE
Liberian
Paiute
Per Capita Income
Per Capita Income Comparison
Liberians
Paiute
$38,780
PER CAPITA INCOME
0.4/ 100
METRIC RATING
268th/ 347
METRIC RANK
$37,066
PER CAPITA INCOME
0.1/ 100
METRIC RATING
303rd/ 347
METRIC RANK
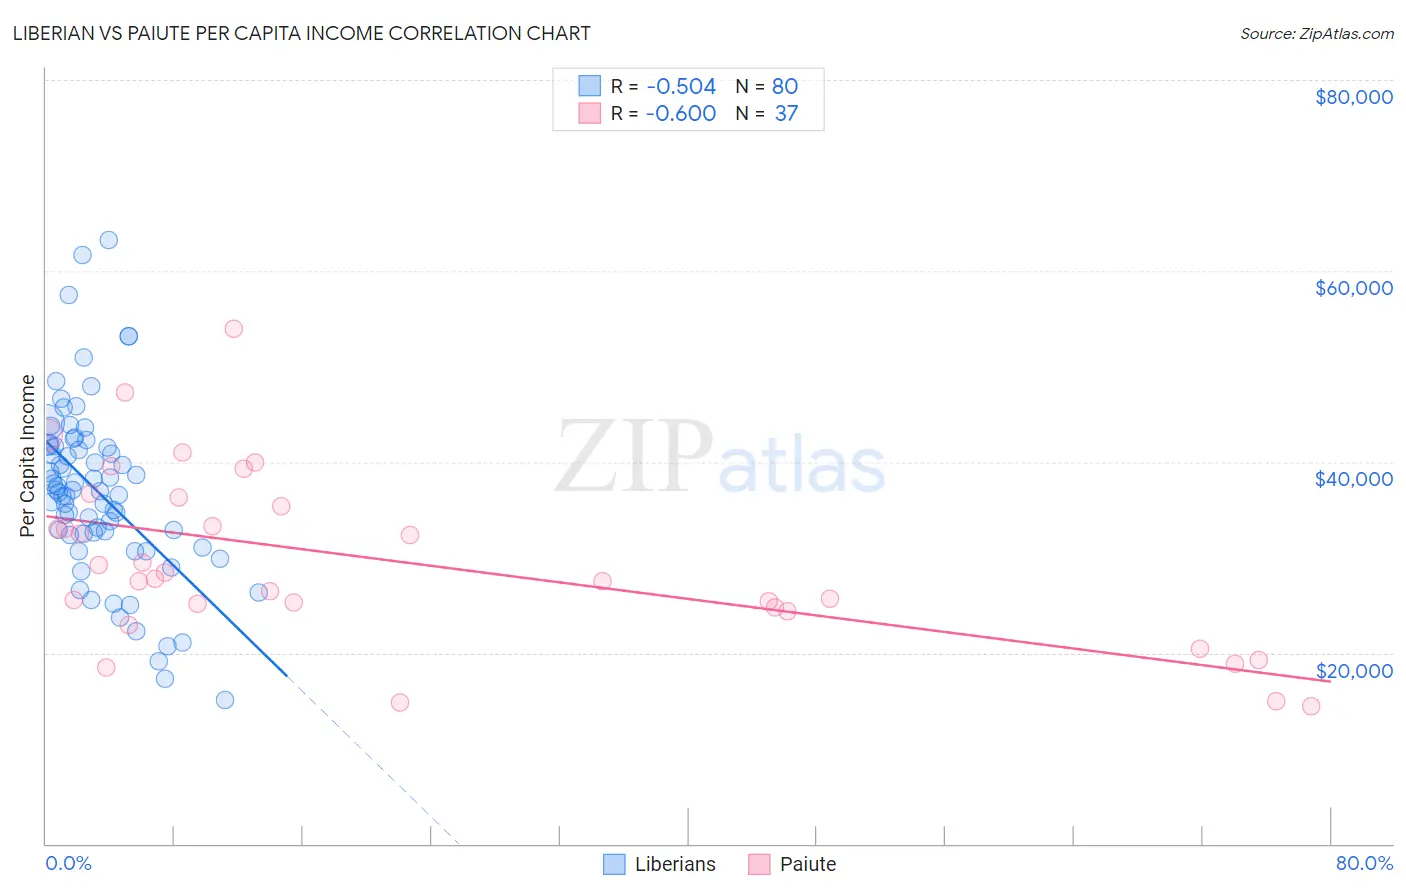
Liberian vs Paiute Per Capita Income Correlation Chart
The statistical analysis conducted on geographies consisting of 118,107,140 people shows a substantial negative correlation between the proportion of Liberians and per capita income in the United States with a correlation coefficient (R) of -0.504 and weighted average of $38,780. Similarly, the statistical analysis conducted on geographies consisting of 58,406,657 people shows a substantial negative correlation between the proportion of Paiute and per capita income in the United States with a correlation coefficient (R) of -0.600 and weighted average of $37,066, a difference of 4.6%.
Per Capita Income Correlation Summary
| Measurement | Liberian | Paiute |
| Minimum | $15,041 | $14,446 |
| Maximum | $63,224 | $53,939 |
| Range | $48,183 | $39,493 |
| Mean | $36,863 | $29,535 |
| Median | $37,001 | $27,776 |
| Interquartile 25% (IQ1) | $32,406 | $24,580 |
| Interquartile 75% (IQ3) | $41,709 | $35,820 |
| Interquartile Range (IQR) | $9,304 | $11,240 |
| Standard Deviation (Sample) | $9,178 | $9,120 |
| Standard Deviation (Population) | $9,120 | $8,996 |
Similar Demographics by Per Capita Income
Demographics Similar to Liberians by Per Capita Income
In terms of per capita income, the demographic groups most similar to Liberians are Immigrants from Jamaica ($38,766, a difference of 0.040%), Immigrants from Zaire ($38,848, a difference of 0.17%), Salvadoran ($38,858, a difference of 0.20%), Immigrants from Belize ($38,614, a difference of 0.43%), and Central American ($38,560, a difference of 0.57%).
| Demographics | Rating | Rank | Per Capita Income |
| Marshallese | 0.6 /100 | #261 | Tragic $39,108 |
| Iroquois | 0.6 /100 | #262 | Tragic $39,104 |
| Belizeans | 0.6 /100 | #263 | Tragic $39,097 |
| Americans | 0.6 /100 | #264 | Tragic $39,039 |
| Spanish Americans | 0.5 /100 | #265 | Tragic $39,012 |
| Salvadorans | 0.5 /100 | #266 | Tragic $38,858 |
| Immigrants | Zaire | 0.4 /100 | #267 | Tragic $38,848 |
| Liberians | 0.4 /100 | #268 | Tragic $38,780 |
| Immigrants | Jamaica | 0.4 /100 | #269 | Tragic $38,766 |
| Immigrants | Belize | 0.3 /100 | #270 | Tragic $38,614 |
| Central Americans | 0.3 /100 | #271 | Tragic $38,560 |
| Immigrants | Cabo Verde | 0.3 /100 | #272 | Tragic $38,540 |
| Nepalese | 0.3 /100 | #273 | Tragic $38,442 |
| Immigrants | El Salvador | 0.3 /100 | #274 | Tragic $38,394 |
| Immigrants | Liberia | 0.2 /100 | #275 | Tragic $38,165 |
Demographics Similar to Paiute by Per Capita Income
In terms of per capita income, the demographic groups most similar to Paiute are Shoshone ($37,072, a difference of 0.020%), Honduran ($37,031, a difference of 0.090%), Ottawa ($37,101, a difference of 0.10%), Inupiat ($36,999, a difference of 0.18%), and Immigrants from Bahamas ($37,193, a difference of 0.34%).
| Demographics | Rating | Rank | Per Capita Income |
| Indonesians | 0.1 /100 | #296 | Tragic $37,300 |
| Haitians | 0.1 /100 | #297 | Tragic $37,289 |
| Immigrants | Caribbean | 0.1 /100 | #298 | Tragic $37,254 |
| Cherokee | 0.1 /100 | #299 | Tragic $37,203 |
| Immigrants | Bahamas | 0.1 /100 | #300 | Tragic $37,193 |
| Ottawa | 0.1 /100 | #301 | Tragic $37,101 |
| Shoshone | 0.1 /100 | #302 | Tragic $37,072 |
| Paiute | 0.1 /100 | #303 | Tragic $37,066 |
| Hondurans | 0.1 /100 | #304 | Tragic $37,031 |
| Inupiat | 0.1 /100 | #305 | Tragic $36,999 |
| Immigrants | Haiti | 0.0 /100 | #306 | Tragic $36,849 |
| Immigrants | Latin America | 0.0 /100 | #307 | Tragic $36,823 |
| Fijians | 0.0 /100 | #308 | Tragic $36,690 |
| Immigrants | Honduras | 0.0 /100 | #309 | Tragic $36,665 |
| Ute | 0.0 /100 | #310 | Tragic $36,651 |