Liberian vs Finnish Per Capita Income
COMPARE
Liberian
Finnish
Per Capita Income
Per Capita Income Comparison
Liberians
Finns
$38,780
PER CAPITA INCOME
0.4/ 100
METRIC RATING
268th/ 347
METRIC RANK
$43,461
PER CAPITA INCOME
44.4/ 100
METRIC RATING
179th/ 347
METRIC RANK
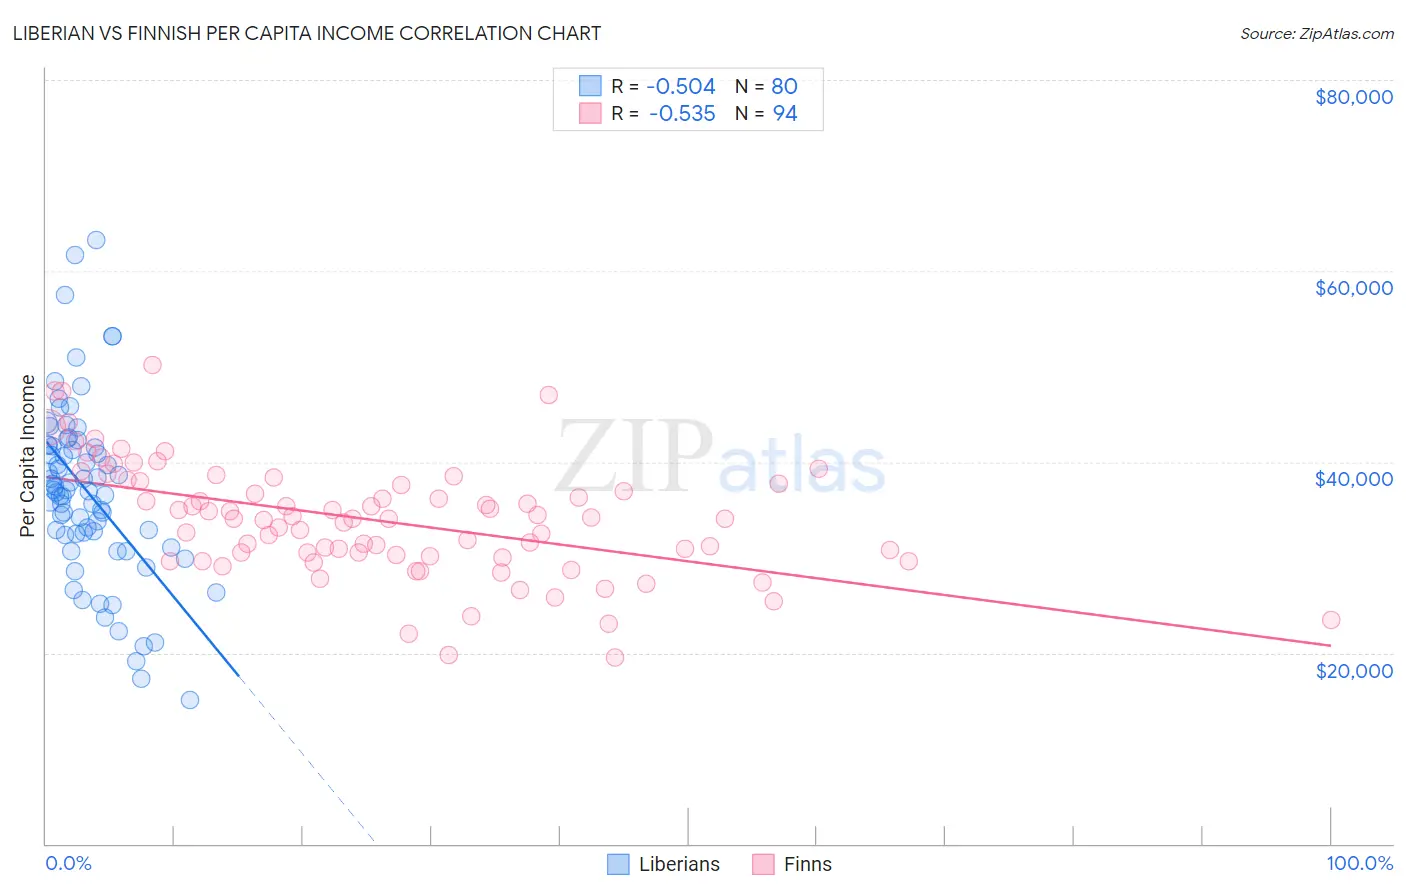
Liberian vs Finnish Per Capita Income Correlation Chart
The statistical analysis conducted on geographies consisting of 118,107,140 people shows a substantial negative correlation between the proportion of Liberians and per capita income in the United States with a correlation coefficient (R) of -0.504 and weighted average of $38,780. Similarly, the statistical analysis conducted on geographies consisting of 404,694,586 people shows a substantial negative correlation between the proportion of Finns and per capita income in the United States with a correlation coefficient (R) of -0.535 and weighted average of $43,461, a difference of 12.1%.
Per Capita Income Correlation Summary
| Measurement | Liberian | Finnish |
| Minimum | $15,041 | $19,546 |
| Maximum | $63,224 | $50,135 |
| Range | $48,183 | $30,589 |
| Mean | $36,863 | $33,846 |
| Median | $37,001 | $34,020 |
| Interquartile 25% (IQ1) | $32,406 | $30,059 |
| Interquartile 75% (IQ3) | $41,709 | $37,749 |
| Interquartile Range (IQR) | $9,304 | $7,690 |
| Standard Deviation (Sample) | $9,178 | $5,978 |
| Standard Deviation (Population) | $9,120 | $5,946 |
Similar Demographics by Per Capita Income
Demographics Similar to Liberians by Per Capita Income
In terms of per capita income, the demographic groups most similar to Liberians are Immigrants from Jamaica ($38,766, a difference of 0.040%), Immigrants from Zaire ($38,848, a difference of 0.17%), Salvadoran ($38,858, a difference of 0.20%), Immigrants from Belize ($38,614, a difference of 0.43%), and Central American ($38,560, a difference of 0.57%).
| Demographics | Rating | Rank | Per Capita Income |
| Marshallese | 0.6 /100 | #261 | Tragic $39,108 |
| Iroquois | 0.6 /100 | #262 | Tragic $39,104 |
| Belizeans | 0.6 /100 | #263 | Tragic $39,097 |
| Americans | 0.6 /100 | #264 | Tragic $39,039 |
| Spanish Americans | 0.5 /100 | #265 | Tragic $39,012 |
| Salvadorans | 0.5 /100 | #266 | Tragic $38,858 |
| Immigrants | Zaire | 0.4 /100 | #267 | Tragic $38,848 |
| Liberians | 0.4 /100 | #268 | Tragic $38,780 |
| Immigrants | Jamaica | 0.4 /100 | #269 | Tragic $38,766 |
| Immigrants | Belize | 0.3 /100 | #270 | Tragic $38,614 |
| Central Americans | 0.3 /100 | #271 | Tragic $38,560 |
| Immigrants | Cabo Verde | 0.3 /100 | #272 | Tragic $38,540 |
| Nepalese | 0.3 /100 | #273 | Tragic $38,442 |
| Immigrants | El Salvador | 0.3 /100 | #274 | Tragic $38,394 |
| Immigrants | Liberia | 0.2 /100 | #275 | Tragic $38,165 |
Demographics Similar to Finns by Per Capita Income
In terms of per capita income, the demographic groups most similar to Finns are Immigrants from Costa Rica ($43,464, a difference of 0.010%), Tlingit-Haida ($43,516, a difference of 0.13%), Sierra Leonean ($43,405, a difference of 0.13%), Immigrants from South Eastern Asia ($43,539, a difference of 0.18%), and Celtic ($43,621, a difference of 0.37%).
| Demographics | Rating | Rank | Per Capita Income |
| Czechoslovakians | 54.1 /100 | #172 | Average $43,806 |
| French | 50.7 /100 | #173 | Average $43,685 |
| Colombians | 50.0 /100 | #174 | Average $43,661 |
| Celtics | 48.9 /100 | #175 | Average $43,621 |
| Immigrants | South Eastern Asia | 46.6 /100 | #176 | Average $43,539 |
| Tlingit-Haida | 45.9 /100 | #177 | Average $43,516 |
| Immigrants | Costa Rica | 44.5 /100 | #178 | Average $43,464 |
| Finns | 44.4 /100 | #179 | Average $43,461 |
| Sierra Leoneans | 42.9 /100 | #180 | Average $43,405 |
| Welsh | 38.2 /100 | #181 | Fair $43,233 |
| Immigrants | Vietnam | 38.1 /100 | #182 | Fair $43,229 |
| Germans | 33.9 /100 | #183 | Fair $43,067 |
| Spaniards | 32.9 /100 | #184 | Fair $43,028 |
| Immigrants | Immigrants | 32.5 /100 | #185 | Fair $43,010 |
| French Canadians | 32.3 /100 | #186 | Fair $43,003 |