Immigrants from Greece vs Immigrants from Burma/Myanmar Per Capita Income
COMPARE
Immigrants from Greece
Immigrants from Burma/Myanmar
Per Capita Income
Per Capita Income Comparison
Immigrants from Greece
Immigrants from Burma/Myanmar
$51,891
PER CAPITA INCOME
100.0/ 100
METRIC RATING
36th/ 347
METRIC RANK
$39,827
PER CAPITA INCOME
1.3/ 100
METRIC RATING
250th/ 347
METRIC RANK
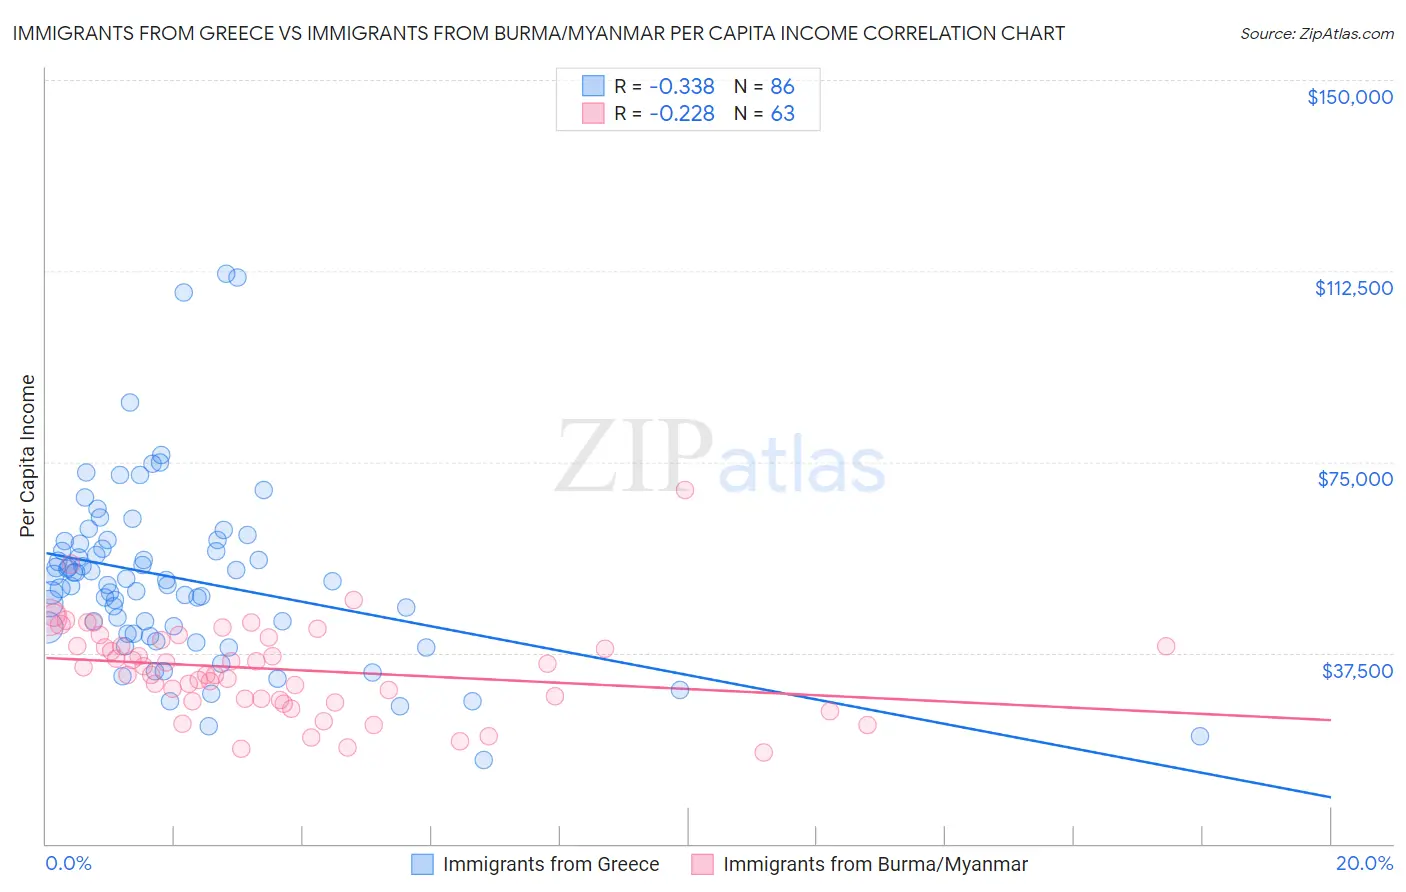
Immigrants from Greece vs Immigrants from Burma/Myanmar Per Capita Income Correlation Chart
The statistical analysis conducted on geographies consisting of 216,879,011 people shows a mild negative correlation between the proportion of Immigrants from Greece and per capita income in the United States with a correlation coefficient (R) of -0.338 and weighted average of $51,891. Similarly, the statistical analysis conducted on geographies consisting of 172,363,704 people shows a weak negative correlation between the proportion of Immigrants from Burma/Myanmar and per capita income in the United States with a correlation coefficient (R) of -0.228 and weighted average of $39,827, a difference of 30.3%.
Per Capita Income Correlation Summary
| Measurement | Immigrants from Greece | Immigrants from Burma/Myanmar |
| Minimum | $16,481 | $17,897 |
| Maximum | $111,988 | $69,358 |
| Range | $95,507 | $51,461 |
| Mean | $52,082 | $34,299 |
| Median | $51,208 | $34,636 |
| Interquartile 25% (IQ1) | $41,348 | $28,210 |
| Interquartile 75% (IQ3) | $58,850 | $40,057 |
| Interquartile Range (IQR) | $17,502 | $11,847 |
| Standard Deviation (Sample) | $17,408 | $9,103 |
| Standard Deviation (Population) | $17,307 | $9,031 |
Similar Demographics by Per Capita Income
Demographics Similar to Immigrants from Greece by Per Capita Income
In terms of per capita income, the demographic groups most similar to Immigrants from Greece are Estonian ($51,875, a difference of 0.030%), Burmese ($52,005, a difference of 0.22%), Immigrants from Czechoslovakia ($51,770, a difference of 0.23%), Immigrants from Russia ($52,044, a difference of 0.29%), and Cambodian ($51,731, a difference of 0.31%).
| Demographics | Rating | Rank | Per Capita Income |
| Israelis | 100.0 /100 | #29 | Exceptional $52,596 |
| Immigrants | Austria | 100.0 /100 | #30 | Exceptional $52,503 |
| Turks | 100.0 /100 | #31 | Exceptional $52,391 |
| Immigrants | Norway | 100.0 /100 | #32 | Exceptional $52,217 |
| Australians | 100.0 /100 | #33 | Exceptional $52,074 |
| Immigrants | Russia | 100.0 /100 | #34 | Exceptional $52,044 |
| Burmese | 100.0 /100 | #35 | Exceptional $52,005 |
| Immigrants | Greece | 100.0 /100 | #36 | Exceptional $51,891 |
| Estonians | 100.0 /100 | #37 | Exceptional $51,875 |
| Immigrants | Czechoslovakia | 100.0 /100 | #38 | Exceptional $51,770 |
| Cambodians | 100.0 /100 | #39 | Exceptional $51,731 |
| Immigrants | Korea | 100.0 /100 | #40 | Exceptional $51,671 |
| Immigrants | South Africa | 100.0 /100 | #41 | Exceptional $51,465 |
| Immigrants | Turkey | 100.0 /100 | #42 | Exceptional $51,368 |
| Immigrants | Lithuania | 100.0 /100 | #43 | Exceptional $51,361 |
Demographics Similar to Immigrants from Burma/Myanmar by Per Capita Income
In terms of per capita income, the demographic groups most similar to Immigrants from Burma/Myanmar are Samoan ($39,826, a difference of 0.0%), Japanese ($39,870, a difference of 0.11%), Cape Verdean ($39,935, a difference of 0.27%), Immigrants from Somalia ($39,974, a difference of 0.37%), and Immigrants from the Azores ($39,608, a difference of 0.55%).
| Demographics | Rating | Rank | Per Capita Income |
| German Russians | 2.2 /100 | #243 | Tragic $40,266 |
| French American Indians | 2.1 /100 | #244 | Tragic $40,244 |
| Sub-Saharan Africans | 1.9 /100 | #245 | Tragic $40,152 |
| Cree | 1.7 /100 | #246 | Tragic $40,056 |
| Immigrants | Somalia | 1.6 /100 | #247 | Tragic $39,974 |
| Cape Verdeans | 1.5 /100 | #248 | Tragic $39,935 |
| Japanese | 1.4 /100 | #249 | Tragic $39,870 |
| Immigrants | Burma/Myanmar | 1.3 /100 | #250 | Tragic $39,827 |
| Samoans | 1.3 /100 | #251 | Tragic $39,826 |
| Immigrants | Azores | 1.0 /100 | #252 | Tragic $39,608 |
| Osage | 1.0 /100 | #253 | Tragic $39,568 |
| Alaska Natives | 1.0 /100 | #254 | Tragic $39,558 |
| Immigrants | Middle Africa | 1.0 /100 | #255 | Tragic $39,529 |
| Hawaiians | 0.8 /100 | #256 | Tragic $39,403 |
| Nicaraguans | 0.8 /100 | #257 | Tragic $39,372 |