Laotian vs Immigrants from Central America Median Household Income
COMPARE
Laotian
Immigrants from Central America
Median Household Income
Median Household Income Comparison
Laotians
Immigrants from Central America
$94,990
MEDIAN HOUSEHOLD INCOME
99.8/ 100
METRIC RATING
61st/ 347
METRIC RANK
$74,217
MEDIAN HOUSEHOLD INCOME
0.1/ 100
METRIC RATING
288th/ 347
METRIC RANK
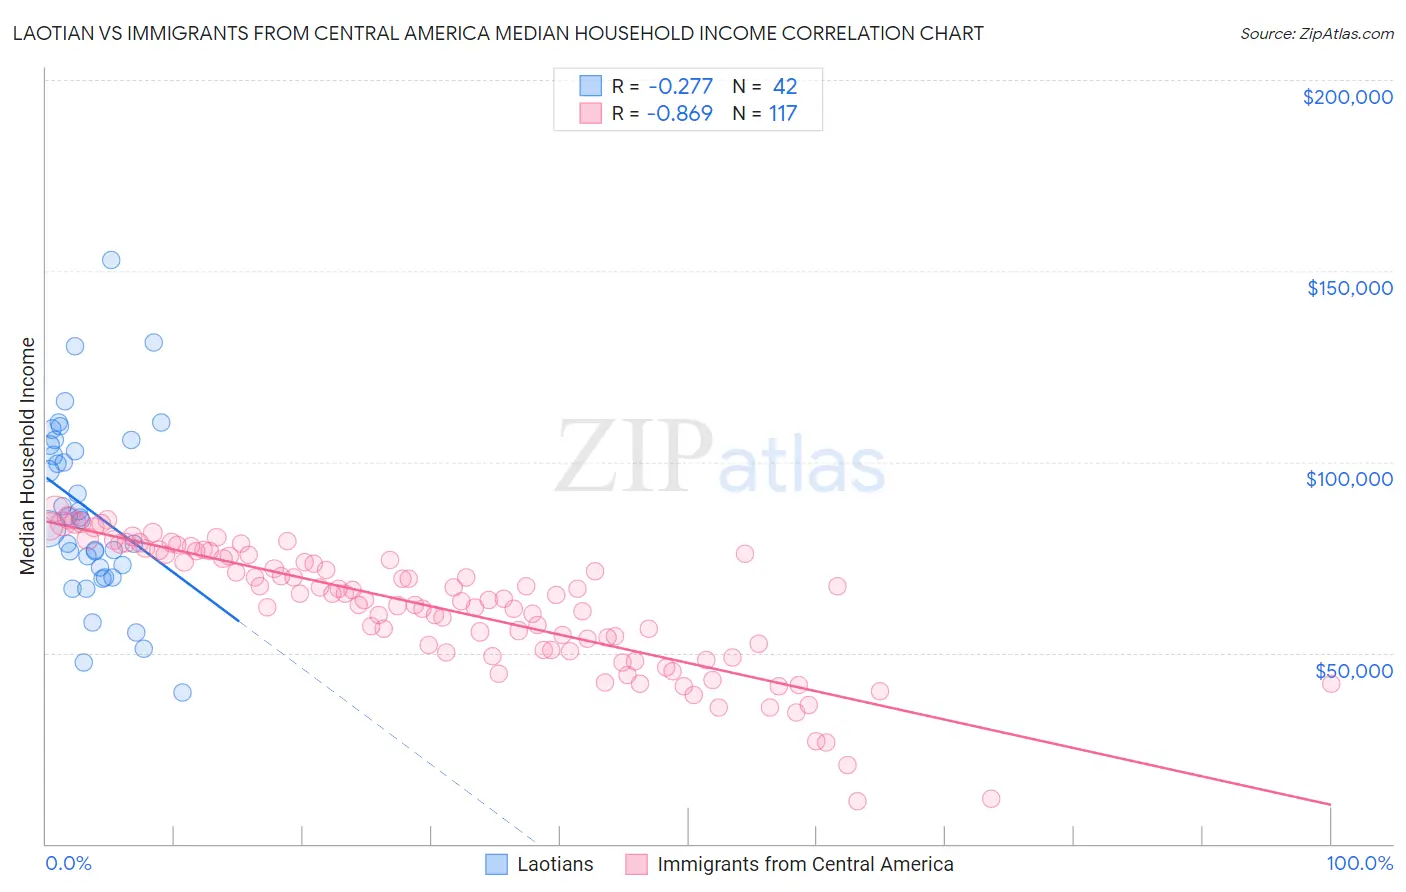
Laotian vs Immigrants from Central America Median Household Income Correlation Chart
The statistical analysis conducted on geographies consisting of 224,713,642 people shows a weak negative correlation between the proportion of Laotians and median household income in the United States with a correlation coefficient (R) of -0.277 and weighted average of $94,990. Similarly, the statistical analysis conducted on geographies consisting of 535,748,911 people shows a very strong negative correlation between the proportion of Immigrants from Central America and median household income in the United States with a correlation coefficient (R) of -0.869 and weighted average of $74,217, a difference of 28.0%.
Median Household Income Correlation Summary
| Measurement | Laotian | Immigrants from Central America |
| Minimum | $39,542 | $11,125 |
| Maximum | $153,021 | $87,880 |
| Range | $113,479 | $76,755 |
| Mean | $87,400 | $61,825 |
| Median | $85,171 | $64,116 |
| Interquartile 25% (IQ1) | $72,352 | $50,458 |
| Interquartile 75% (IQ3) | $104,389 | $75,695 |
| Interquartile Range (IQR) | $32,037 | $25,237 |
| Standard Deviation (Sample) | $23,584 | $16,428 |
| Standard Deviation (Population) | $23,302 | $16,358 |
Similar Demographics by Median Household Income
Demographics Similar to Laotians by Median Household Income
In terms of median household income, the demographic groups most similar to Laotians are Korean ($95,018, a difference of 0.030%), Immigrants from Europe ($95,032, a difference of 0.040%), Soviet Union ($95,098, a difference of 0.11%), Immigrants from Norway ($94,846, a difference of 0.15%), and New Zealander ($95,146, a difference of 0.16%).
| Demographics | Rating | Rank | Median Household Income |
| Egyptians | 99.9 /100 | #54 | Exceptional $95,673 |
| Immigrants | Czechoslovakia | 99.9 /100 | #55 | Exceptional $95,319 |
| Immigrants | Austria | 99.9 /100 | #56 | Exceptional $95,277 |
| New Zealanders | 99.8 /100 | #57 | Exceptional $95,146 |
| Soviet Union | 99.8 /100 | #58 | Exceptional $95,098 |
| Immigrants | Europe | 99.8 /100 | #59 | Exceptional $95,032 |
| Koreans | 99.8 /100 | #60 | Exceptional $95,018 |
| Laotians | 99.8 /100 | #61 | Exceptional $94,990 |
| Immigrants | Norway | 99.8 /100 | #62 | Exceptional $94,846 |
| Greeks | 99.8 /100 | #63 | Exceptional $94,735 |
| Immigrants | Netherlands | 99.7 /100 | #64 | Exceptional $94,411 |
| Immigrants | Belarus | 99.7 /100 | #65 | Exceptional $94,399 |
| Immigrants | Romania | 99.7 /100 | #66 | Exceptional $94,222 |
| Immigrants | Scotland | 99.7 /100 | #67 | Exceptional $94,091 |
| Mongolians | 99.7 /100 | #68 | Exceptional $93,971 |
Demographics Similar to Immigrants from Central America by Median Household Income
In terms of median household income, the demographic groups most similar to Immigrants from Central America are Fijian ($74,205, a difference of 0.020%), Iroquois ($74,279, a difference of 0.080%), Immigrants from Somalia ($74,300, a difference of 0.11%), Bangladeshi ($74,112, a difference of 0.14%), and Mexican ($74,399, a difference of 0.24%).
| Demographics | Rating | Rank | Median Household Income |
| Immigrants | Liberia | 0.1 /100 | #281 | Tragic $74,896 |
| Central American Indians | 0.1 /100 | #282 | Tragic $74,847 |
| Cree | 0.1 /100 | #283 | Tragic $74,685 |
| Yaqui | 0.1 /100 | #284 | Tragic $74,596 |
| Mexicans | 0.1 /100 | #285 | Tragic $74,399 |
| Immigrants | Somalia | 0.1 /100 | #286 | Tragic $74,300 |
| Iroquois | 0.1 /100 | #287 | Tragic $74,279 |
| Immigrants | Central America | 0.1 /100 | #288 | Tragic $74,217 |
| Fijians | 0.1 /100 | #289 | Tragic $74,205 |
| Bangladeshis | 0.1 /100 | #290 | Tragic $74,112 |
| Hispanics or Latinos | 0.1 /100 | #291 | Tragic $73,823 |
| Comanche | 0.1 /100 | #292 | Tragic $73,747 |
| Immigrants | Cabo Verde | 0.1 /100 | #293 | Tragic $73,515 |
| Blackfeet | 0.1 /100 | #294 | Tragic $73,509 |
| Cubans | 0.1 /100 | #295 | Tragic $73,392 |