Laotian vs Immigrants from Philippines Median Household Income
COMPARE
Laotian
Immigrants from Philippines
Median Household Income
Median Household Income Comparison
Laotians
Immigrants from Philippines
$94,990
MEDIAN HOUSEHOLD INCOME
99.8/ 100
METRIC RATING
61st/ 347
METRIC RANK
$93,899
MEDIAN HOUSEHOLD INCOME
99.6/ 100
METRIC RATING
71st/ 347
METRIC RANK
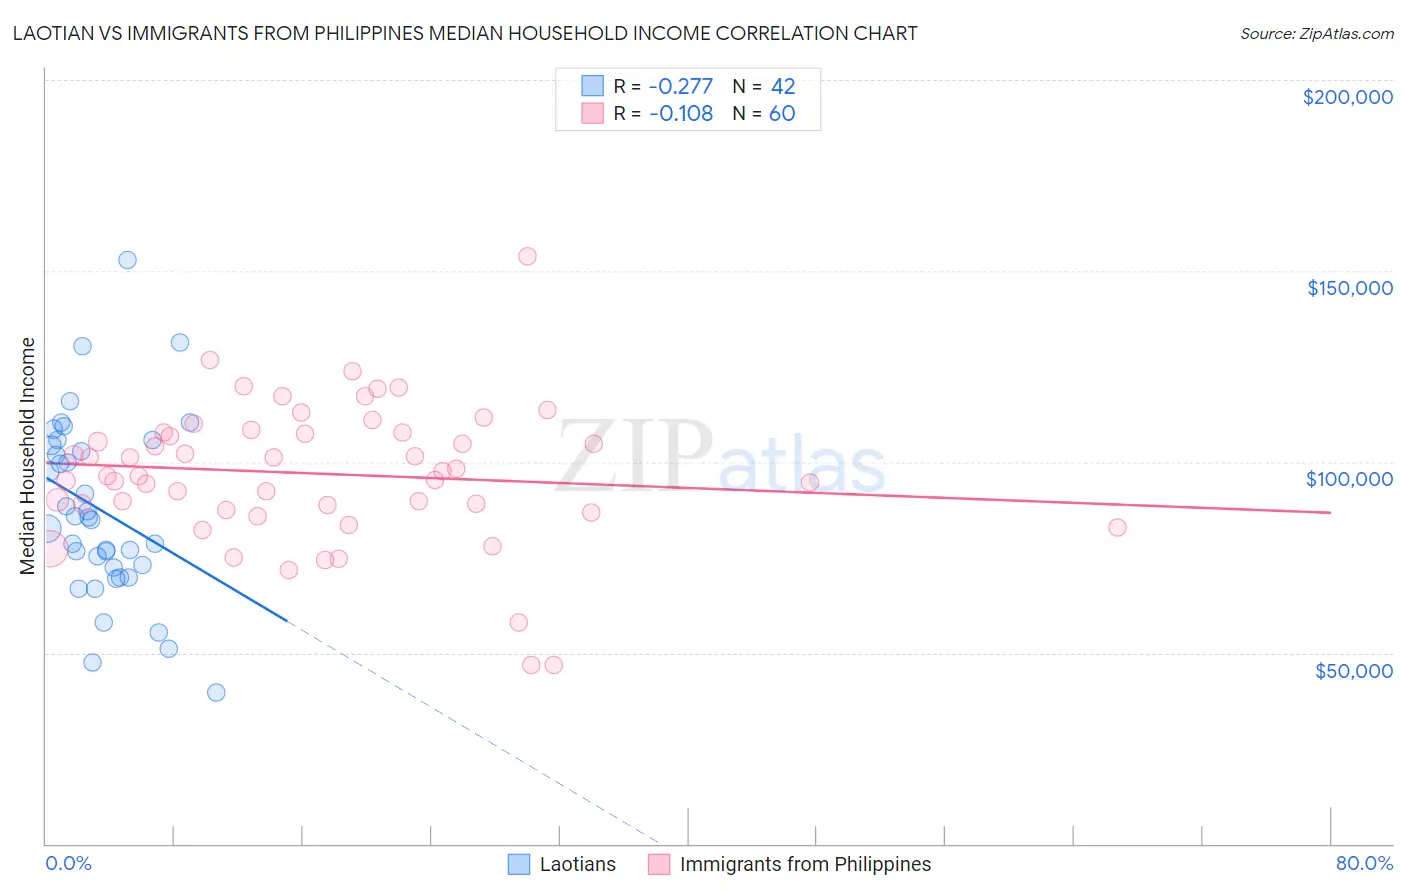
Laotian vs Immigrants from Philippines Median Household Income Correlation Chart
The statistical analysis conducted on geographies consisting of 224,713,642 people shows a weak negative correlation between the proportion of Laotians and median household income in the United States with a correlation coefficient (R) of -0.277 and weighted average of $94,990. Similarly, the statistical analysis conducted on geographies consisting of 470,926,305 people shows a poor negative correlation between the proportion of Immigrants from Philippines and median household income in the United States with a correlation coefficient (R) of -0.108 and weighted average of $93,899, a difference of 1.2%.
Median Household Income Correlation Summary
| Measurement | Laotian | Immigrants from Philippines |
| Minimum | $39,542 | $46,667 |
| Maximum | $153,021 | $153,750 |
| Range | $113,479 | $107,083 |
| Mean | $87,400 | $96,916 |
| Median | $85,171 | $96,925 |
| Interquartile 25% (IQ1) | $72,352 | $88,127 |
| Interquartile 75% (IQ3) | $104,389 | $107,685 |
| Interquartile Range (IQR) | $32,037 | $19,558 |
| Standard Deviation (Sample) | $23,584 | $18,430 |
| Standard Deviation (Population) | $23,302 | $18,276 |
Demographics Similar to Laotians and Immigrants from Philippines by Median Household Income
In terms of median household income, the demographic groups most similar to Laotians are Korean ($95,018, a difference of 0.030%), Immigrants from Europe ($95,032, a difference of 0.040%), Soviet Union ($95,098, a difference of 0.11%), Immigrants from Norway ($94,846, a difference of 0.15%), and New Zealander ($95,146, a difference of 0.16%). Similarly, the demographic groups most similar to Immigrants from Philippines are Immigrants from Fiji ($93,933, a difference of 0.040%), Lithuanian ($93,852, a difference of 0.050%), Argentinean ($93,960, a difference of 0.070%), Mongolian ($93,971, a difference of 0.080%), and Immigrants from Scotland ($94,091, a difference of 0.20%).
| Demographics | Rating | Rank | Median Household Income |
| Immigrants | Austria | 99.9 /100 | #56 | Exceptional $95,277 |
| New Zealanders | 99.8 /100 | #57 | Exceptional $95,146 |
| Soviet Union | 99.8 /100 | #58 | Exceptional $95,098 |
| Immigrants | Europe | 99.8 /100 | #59 | Exceptional $95,032 |
| Koreans | 99.8 /100 | #60 | Exceptional $95,018 |
| Laotians | 99.8 /100 | #61 | Exceptional $94,990 |
| Immigrants | Norway | 99.8 /100 | #62 | Exceptional $94,846 |
| Greeks | 99.8 /100 | #63 | Exceptional $94,735 |
| Immigrants | Netherlands | 99.7 /100 | #64 | Exceptional $94,411 |
| Immigrants | Belarus | 99.7 /100 | #65 | Exceptional $94,399 |
| Immigrants | Romania | 99.7 /100 | #66 | Exceptional $94,222 |
| Immigrants | Scotland | 99.7 /100 | #67 | Exceptional $94,091 |
| Mongolians | 99.7 /100 | #68 | Exceptional $93,971 |
| Argentineans | 99.7 /100 | #69 | Exceptional $93,960 |
| Immigrants | Fiji | 99.7 /100 | #70 | Exceptional $93,933 |
| Immigrants | Philippines | 99.6 /100 | #71 | Exceptional $93,899 |
| Lithuanians | 99.6 /100 | #72 | Exceptional $93,852 |
| Immigrants | Egypt | 99.6 /100 | #73 | Exceptional $93,700 |
| Immigrants | Latvia | 99.6 /100 | #74 | Exceptional $93,602 |
| Immigrants | Italy | 99.5 /100 | #75 | Exceptional $93,465 |
| South Africans | 99.5 /100 | #76 | Exceptional $93,379 |