Choctaw vs Immigrants from Philippines Median Household Income
COMPARE
Choctaw
Immigrants from Philippines
Median Household Income
Median Household Income Comparison
Choctaw
Immigrants from Philippines
$69,947
MEDIAN HOUSEHOLD INCOME
0.0/ 100
METRIC RATING
322nd/ 347
METRIC RANK
$93,899
MEDIAN HOUSEHOLD INCOME
99.6/ 100
METRIC RATING
71st/ 347
METRIC RANK
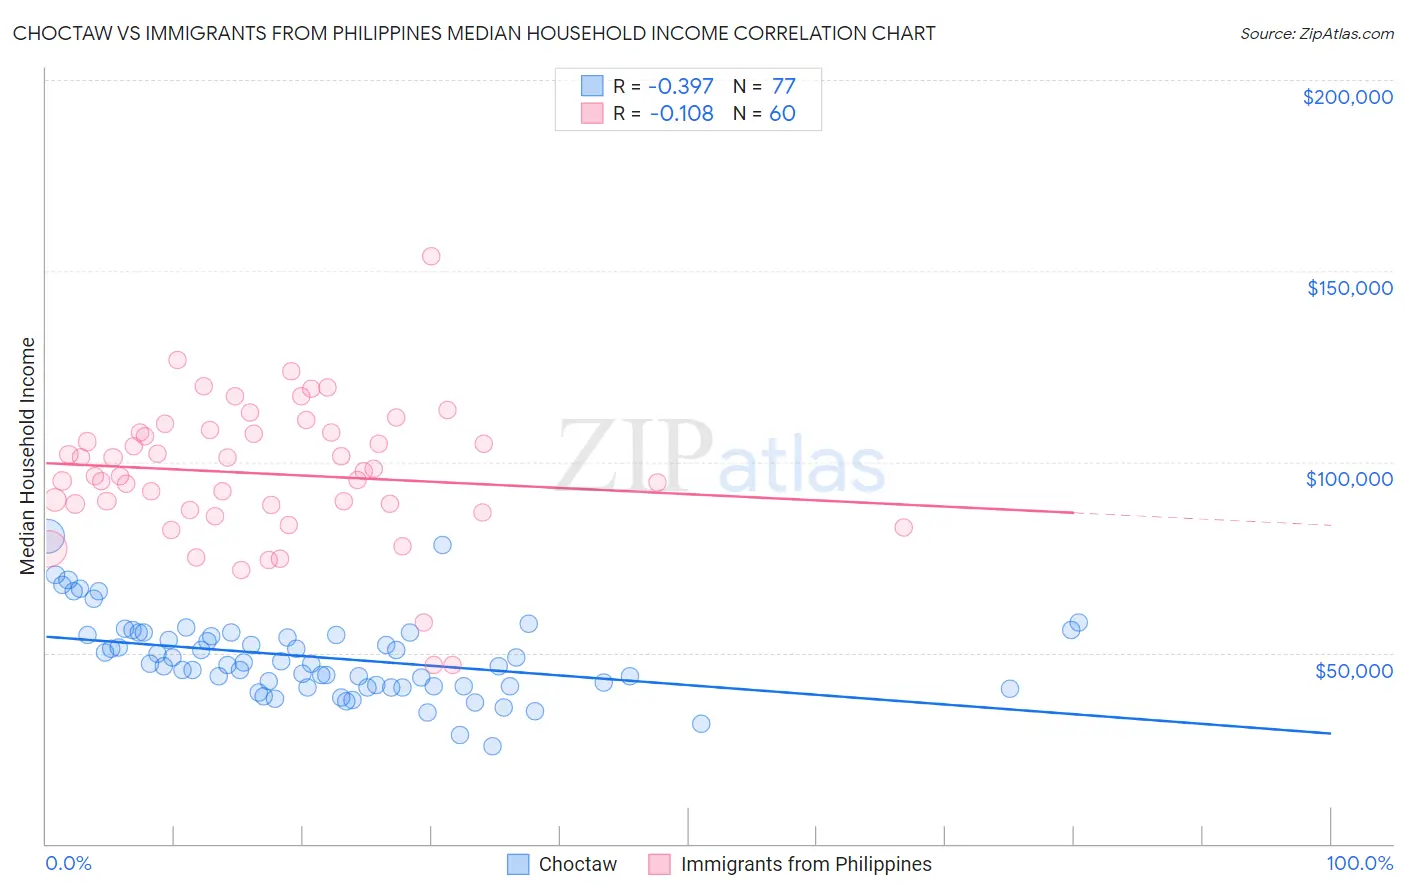
Choctaw vs Immigrants from Philippines Median Household Income Correlation Chart
The statistical analysis conducted on geographies consisting of 269,579,280 people shows a mild negative correlation between the proportion of Choctaw and median household income in the United States with a correlation coefficient (R) of -0.397 and weighted average of $69,947. Similarly, the statistical analysis conducted on geographies consisting of 470,926,305 people shows a poor negative correlation between the proportion of Immigrants from Philippines and median household income in the United States with a correlation coefficient (R) of -0.108 and weighted average of $93,899, a difference of 34.2%.
Median Household Income Correlation Summary
| Measurement | Choctaw | Immigrants from Philippines |
| Minimum | $25,625 | $46,667 |
| Maximum | $80,457 | $153,750 |
| Range | $54,832 | $107,083 |
| Mean | $48,786 | $96,916 |
| Median | $47,101 | $96,925 |
| Interquartile 25% (IQ1) | $41,215 | $88,127 |
| Interquartile 75% (IQ3) | $54,919 | $107,685 |
| Interquartile Range (IQR) | $13,705 | $19,558 |
| Standard Deviation (Sample) | $10,591 | $18,430 |
| Standard Deviation (Population) | $10,522 | $18,276 |
Similar Demographics by Median Household Income
Demographics Similar to Choctaw by Median Household Income
In terms of median household income, the demographic groups most similar to Choctaw are Chickasaw ($70,005, a difference of 0.080%), Colville ($70,094, a difference of 0.21%), Bahamian ($69,726, a difference of 0.32%), Yup'ik ($69,695, a difference of 0.36%), and Immigrants from Dominican Republic ($70,208, a difference of 0.37%).
| Demographics | Rating | Rank | Median Household Income |
| Ottawa | 0.0 /100 | #315 | Tragic $70,984 |
| Apache | 0.0 /100 | #316 | Tragic $70,927 |
| Cajuns | 0.0 /100 | #317 | Tragic $70,605 |
| Chippewa | 0.0 /100 | #318 | Tragic $70,539 |
| Immigrants | Dominican Republic | 0.0 /100 | #319 | Tragic $70,208 |
| Colville | 0.0 /100 | #320 | Tragic $70,094 |
| Chickasaw | 0.0 /100 | #321 | Tragic $70,005 |
| Choctaw | 0.0 /100 | #322 | Tragic $69,947 |
| Bahamians | 0.0 /100 | #323 | Tragic $69,726 |
| Yup'ik | 0.0 /100 | #324 | Tragic $69,695 |
| Seminole | 0.0 /100 | #325 | Tragic $69,420 |
| Yuman | 0.0 /100 | #326 | Tragic $68,743 |
| Immigrants | Cuba | 0.0 /100 | #327 | Tragic $68,461 |
| Menominee | 0.0 /100 | #328 | Tragic $68,423 |
| Dutch West Indians | 0.0 /100 | #329 | Tragic $68,412 |
Demographics Similar to Immigrants from Philippines by Median Household Income
In terms of median household income, the demographic groups most similar to Immigrants from Philippines are Immigrants from Fiji ($93,933, a difference of 0.040%), Lithuanian ($93,852, a difference of 0.050%), Argentinean ($93,960, a difference of 0.070%), Mongolian ($93,971, a difference of 0.080%), and Immigrants from Scotland ($94,091, a difference of 0.20%).
| Demographics | Rating | Rank | Median Household Income |
| Immigrants | Netherlands | 99.7 /100 | #64 | Exceptional $94,411 |
| Immigrants | Belarus | 99.7 /100 | #65 | Exceptional $94,399 |
| Immigrants | Romania | 99.7 /100 | #66 | Exceptional $94,222 |
| Immigrants | Scotland | 99.7 /100 | #67 | Exceptional $94,091 |
| Mongolians | 99.7 /100 | #68 | Exceptional $93,971 |
| Argentineans | 99.7 /100 | #69 | Exceptional $93,960 |
| Immigrants | Fiji | 99.7 /100 | #70 | Exceptional $93,933 |
| Immigrants | Philippines | 99.6 /100 | #71 | Exceptional $93,899 |
| Lithuanians | 99.6 /100 | #72 | Exceptional $93,852 |
| Immigrants | Egypt | 99.6 /100 | #73 | Exceptional $93,700 |
| Immigrants | Latvia | 99.6 /100 | #74 | Exceptional $93,602 |
| Immigrants | Italy | 99.5 /100 | #75 | Exceptional $93,465 |
| South Africans | 99.5 /100 | #76 | Exceptional $93,379 |
| Immigrants | Afghanistan | 99.5 /100 | #77 | Exceptional $93,375 |
| Immigrants | Bulgaria | 99.4 /100 | #78 | Exceptional $93,148 |