Houma vs Immigrants from Philippines Median Household Income
COMPARE
Houma
Immigrants from Philippines
Median Household Income
Median Household Income Comparison
Houma
Immigrants from Philippines
$62,575
MEDIAN HOUSEHOLD INCOME
0.0/ 100
METRIC RATING
343rd/ 347
METRIC RANK
$93,899
MEDIAN HOUSEHOLD INCOME
99.6/ 100
METRIC RATING
71st/ 347
METRIC RANK
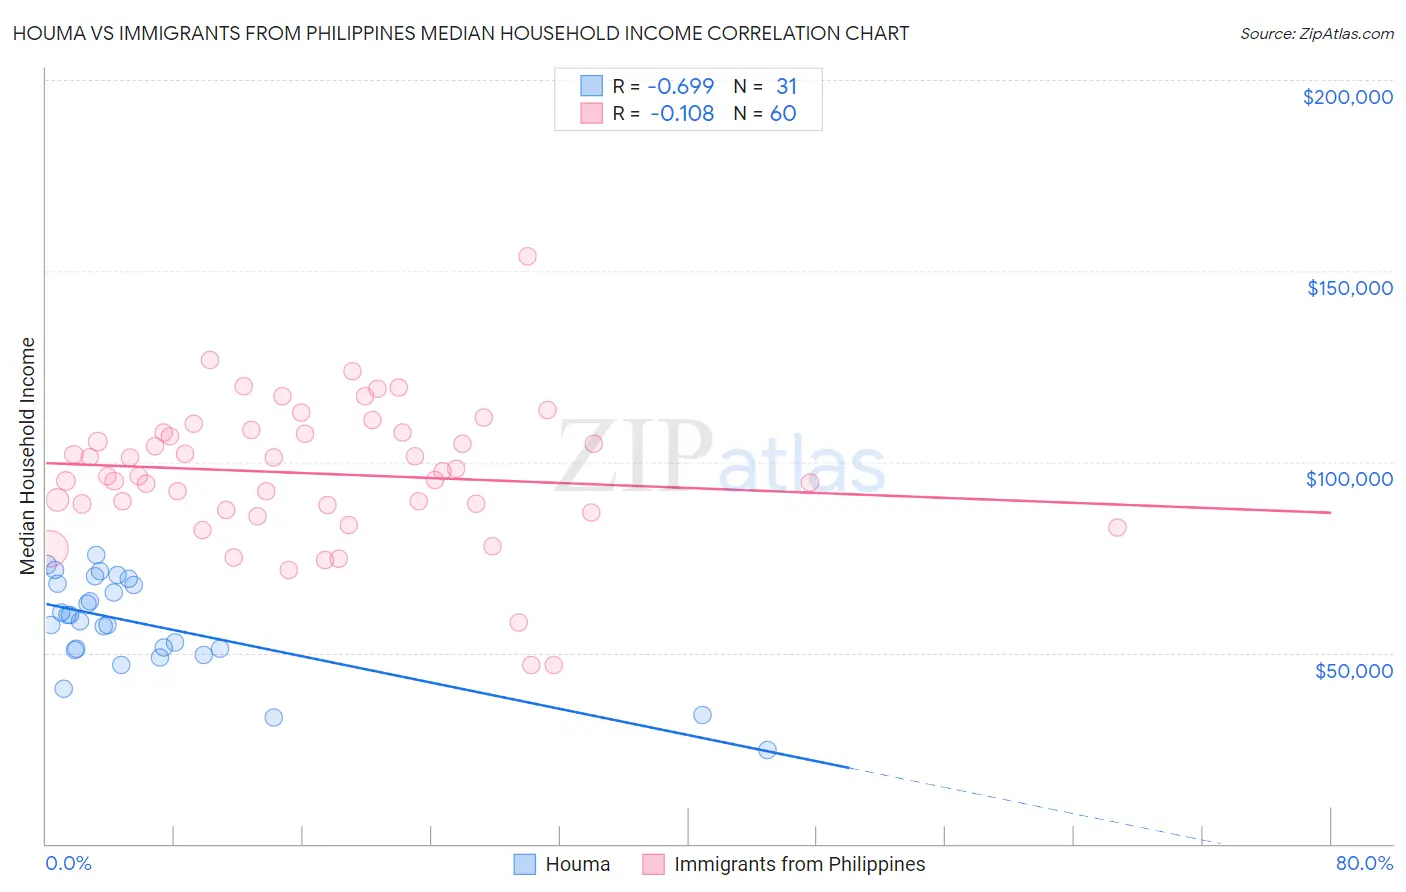
Houma vs Immigrants from Philippines Median Household Income Correlation Chart
The statistical analysis conducted on geographies consisting of 36,792,126 people shows a significant negative correlation between the proportion of Houma and median household income in the United States with a correlation coefficient (R) of -0.699 and weighted average of $62,575. Similarly, the statistical analysis conducted on geographies consisting of 470,926,305 people shows a poor negative correlation between the proportion of Immigrants from Philippines and median household income in the United States with a correlation coefficient (R) of -0.108 and weighted average of $93,899, a difference of 50.1%.
Median Household Income Correlation Summary
| Measurement | Houma | Immigrants from Philippines |
| Minimum | $24,706 | $46,667 |
| Maximum | $75,521 | $153,750 |
| Range | $50,815 | $107,083 |
| Mean | $57,222 | $96,916 |
| Median | $58,380 | $96,925 |
| Interquartile 25% (IQ1) | $50,766 | $88,127 |
| Interquartile 75% (IQ3) | $68,165 | $107,685 |
| Interquartile Range (IQR) | $17,398 | $19,558 |
| Standard Deviation (Sample) | $12,629 | $18,430 |
| Standard Deviation (Population) | $12,424 | $18,276 |
Similar Demographics by Median Household Income
Demographics Similar to Houma by Median Household Income
In terms of median household income, the demographic groups most similar to Houma are Pima ($63,262, a difference of 1.1%), Tohono O'odham ($61,663, a difference of 1.5%), Crow ($63,681, a difference of 1.8%), Pueblo ($64,692, a difference of 3.4%), and Hopi ($65,043, a difference of 3.9%).
| Demographics | Rating | Rank | Median Household Income |
| Creek | 0.0 /100 | #333 | Tragic $67,715 |
| Blacks/African Americans | 0.0 /100 | #334 | Tragic $67,573 |
| Cheyenne | 0.0 /100 | #335 | Tragic $66,974 |
| Immigrants | Congo | 0.0 /100 | #336 | Tragic $66,768 |
| Kiowa | 0.0 /100 | #337 | Tragic $65,914 |
| Immigrants | Yemen | 0.0 /100 | #338 | Tragic $65,194 |
| Hopi | 0.0 /100 | #339 | Tragic $65,043 |
| Pueblo | 0.0 /100 | #340 | Tragic $64,692 |
| Crow | 0.0 /100 | #341 | Tragic $63,681 |
| Pima | 0.0 /100 | #342 | Tragic $63,262 |
| Houma | 0.0 /100 | #343 | Tragic $62,575 |
| Tohono O'odham | 0.0 /100 | #344 | Tragic $61,663 |
| Puerto Ricans | 0.0 /100 | #345 | Tragic $59,197 |
| Navajo | 0.0 /100 | #346 | Tragic $59,159 |
| Lumbee | 0.0 /100 | #347 | Tragic $54,644 |
Demographics Similar to Immigrants from Philippines by Median Household Income
In terms of median household income, the demographic groups most similar to Immigrants from Philippines are Immigrants from Fiji ($93,933, a difference of 0.040%), Lithuanian ($93,852, a difference of 0.050%), Argentinean ($93,960, a difference of 0.070%), Mongolian ($93,971, a difference of 0.080%), and Immigrants from Scotland ($94,091, a difference of 0.20%).
| Demographics | Rating | Rank | Median Household Income |
| Immigrants | Netherlands | 99.7 /100 | #64 | Exceptional $94,411 |
| Immigrants | Belarus | 99.7 /100 | #65 | Exceptional $94,399 |
| Immigrants | Romania | 99.7 /100 | #66 | Exceptional $94,222 |
| Immigrants | Scotland | 99.7 /100 | #67 | Exceptional $94,091 |
| Mongolians | 99.7 /100 | #68 | Exceptional $93,971 |
| Argentineans | 99.7 /100 | #69 | Exceptional $93,960 |
| Immigrants | Fiji | 99.7 /100 | #70 | Exceptional $93,933 |
| Immigrants | Philippines | 99.6 /100 | #71 | Exceptional $93,899 |
| Lithuanians | 99.6 /100 | #72 | Exceptional $93,852 |
| Immigrants | Egypt | 99.6 /100 | #73 | Exceptional $93,700 |
| Immigrants | Latvia | 99.6 /100 | #74 | Exceptional $93,602 |
| Immigrants | Italy | 99.5 /100 | #75 | Exceptional $93,465 |
| South Africans | 99.5 /100 | #76 | Exceptional $93,379 |
| Immigrants | Afghanistan | 99.5 /100 | #77 | Exceptional $93,375 |
| Immigrants | Bulgaria | 99.4 /100 | #78 | Exceptional $93,148 |