Ghanaian vs Immigrants from Philippines Median Household Income
COMPARE
Ghanaian
Immigrants from Philippines
Median Household Income
Median Household Income Comparison
Ghanaians
Immigrants from Philippines
$83,582
MEDIAN HOUSEHOLD INCOME
27.4/ 100
METRIC RATING
194th/ 347
METRIC RANK
$93,899
MEDIAN HOUSEHOLD INCOME
99.6/ 100
METRIC RATING
71st/ 347
METRIC RANK
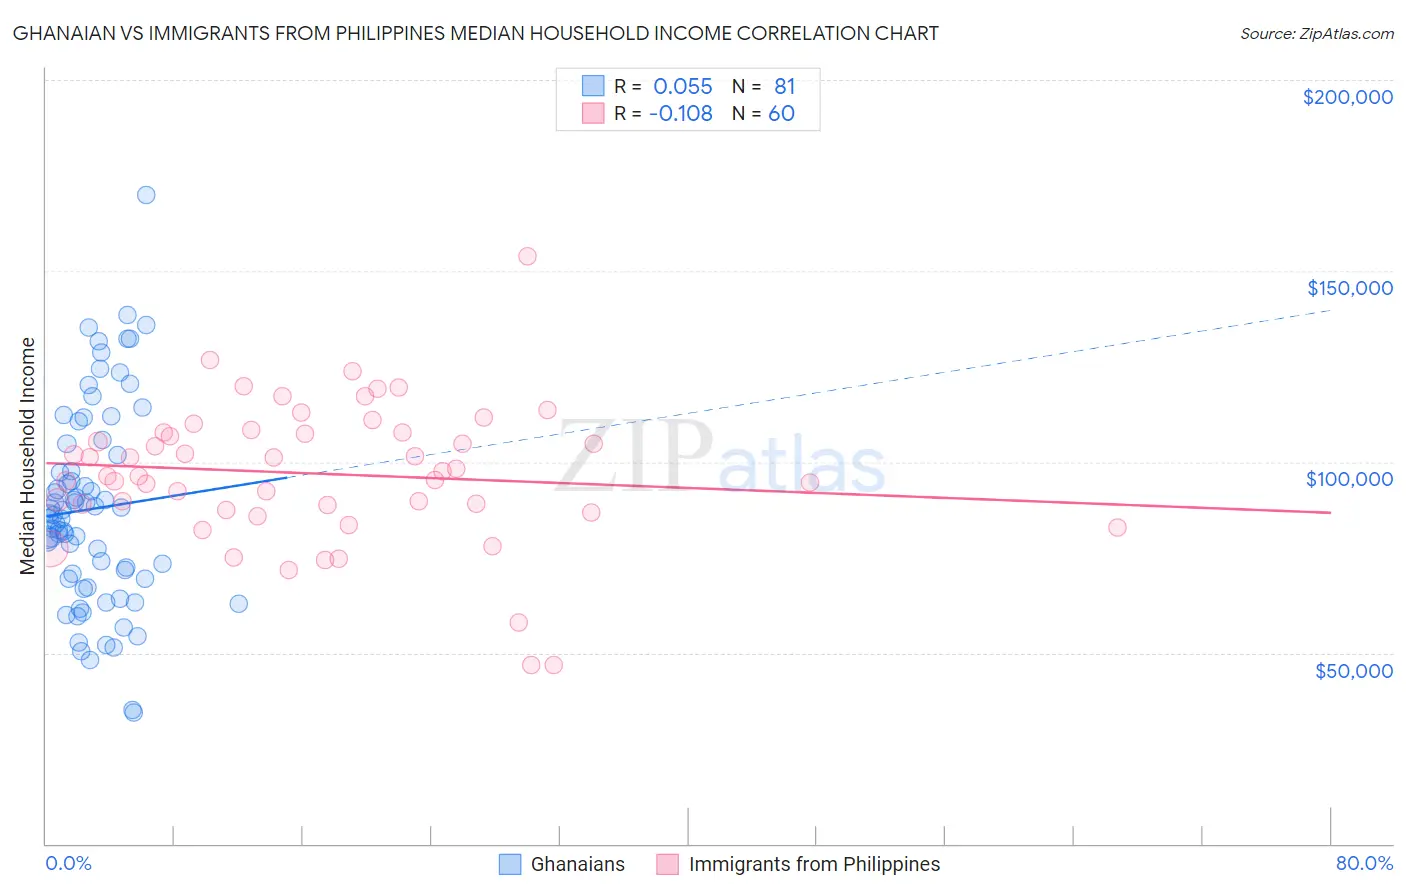
Ghanaian vs Immigrants from Philippines Median Household Income Correlation Chart
The statistical analysis conducted on geographies consisting of 190,498,021 people shows a slight positive correlation between the proportion of Ghanaians and median household income in the United States with a correlation coefficient (R) of 0.055 and weighted average of $83,582. Similarly, the statistical analysis conducted on geographies consisting of 470,926,305 people shows a poor negative correlation between the proportion of Immigrants from Philippines and median household income in the United States with a correlation coefficient (R) of -0.108 and weighted average of $93,899, a difference of 12.3%.
Median Household Income Correlation Summary
| Measurement | Ghanaian | Immigrants from Philippines |
| Minimum | $34,375 | $46,667 |
| Maximum | $169,773 | $153,750 |
| Range | $135,398 | $107,083 |
| Mean | $87,698 | $96,916 |
| Median | $86,122 | $96,925 |
| Interquartile 25% (IQ1) | $69,414 | $88,127 |
| Interquartile 75% (IQ3) | $103,226 | $107,685 |
| Interquartile Range (IQR) | $33,812 | $19,558 |
| Standard Deviation (Sample) | $26,089 | $18,430 |
| Standard Deviation (Population) | $25,928 | $18,276 |
Similar Demographics by Median Household Income
Demographics Similar to Ghanaians by Median Household Income
In terms of median household income, the demographic groups most similar to Ghanaians are Finnish ($83,607, a difference of 0.030%), Immigrants from Armenia ($83,555, a difference of 0.030%), Welsh ($83,628, a difference of 0.060%), French ($83,468, a difference of 0.14%), and Aleut ($83,446, a difference of 0.16%).
| Demographics | Rating | Rank | Median Household Income |
| Belgians | 33.2 /100 | #187 | Fair $84,008 |
| Tlingit-Haida | 32.6 /100 | #188 | Fair $83,968 |
| Immigrants | Colombia | 31.7 /100 | #189 | Fair $83,902 |
| Slovaks | 30.2 /100 | #190 | Fair $83,798 |
| Iraqis | 29.6 /100 | #191 | Fair $83,753 |
| Welsh | 28.0 /100 | #192 | Fair $83,628 |
| Finns | 27.7 /100 | #193 | Fair $83,607 |
| Ghanaians | 27.4 /100 | #194 | Fair $83,582 |
| Immigrants | Armenia | 27.0 /100 | #195 | Fair $83,555 |
| French | 26.0 /100 | #196 | Fair $83,468 |
| Aleuts | 25.7 /100 | #197 | Fair $83,446 |
| Japanese | 25.1 /100 | #198 | Fair $83,395 |
| Germans | 24.6 /100 | #199 | Fair $83,358 |
| Tsimshian | 24.5 /100 | #200 | Fair $83,346 |
| Spanish | 24.4 /100 | #201 | Fair $83,343 |
Demographics Similar to Immigrants from Philippines by Median Household Income
In terms of median household income, the demographic groups most similar to Immigrants from Philippines are Immigrants from Fiji ($93,933, a difference of 0.040%), Lithuanian ($93,852, a difference of 0.050%), Argentinean ($93,960, a difference of 0.070%), Mongolian ($93,971, a difference of 0.080%), and Immigrants from Scotland ($94,091, a difference of 0.20%).
| Demographics | Rating | Rank | Median Household Income |
| Immigrants | Netherlands | 99.7 /100 | #64 | Exceptional $94,411 |
| Immigrants | Belarus | 99.7 /100 | #65 | Exceptional $94,399 |
| Immigrants | Romania | 99.7 /100 | #66 | Exceptional $94,222 |
| Immigrants | Scotland | 99.7 /100 | #67 | Exceptional $94,091 |
| Mongolians | 99.7 /100 | #68 | Exceptional $93,971 |
| Argentineans | 99.7 /100 | #69 | Exceptional $93,960 |
| Immigrants | Fiji | 99.7 /100 | #70 | Exceptional $93,933 |
| Immigrants | Philippines | 99.6 /100 | #71 | Exceptional $93,899 |
| Lithuanians | 99.6 /100 | #72 | Exceptional $93,852 |
| Immigrants | Egypt | 99.6 /100 | #73 | Exceptional $93,700 |
| Immigrants | Latvia | 99.6 /100 | #74 | Exceptional $93,602 |
| Immigrants | Italy | 99.5 /100 | #75 | Exceptional $93,465 |
| South Africans | 99.5 /100 | #76 | Exceptional $93,379 |
| Immigrants | Afghanistan | 99.5 /100 | #77 | Exceptional $93,375 |
| Immigrants | Bulgaria | 99.4 /100 | #78 | Exceptional $93,148 |