Korean vs White/Caucasian Cognitive Disability
COMPARE
Korean
White/Caucasian
Cognitive Disability
Cognitive Disability Comparison
Koreans
Whites/Caucasians
16.8%
COGNITIVE DISABILITY
97.1/ 100
METRIC RATING
114th/ 347
METRIC RANK
17.0%
COGNITIVE DISABILITY
92.1/ 100
METRIC RATING
132nd/ 347
METRIC RANK
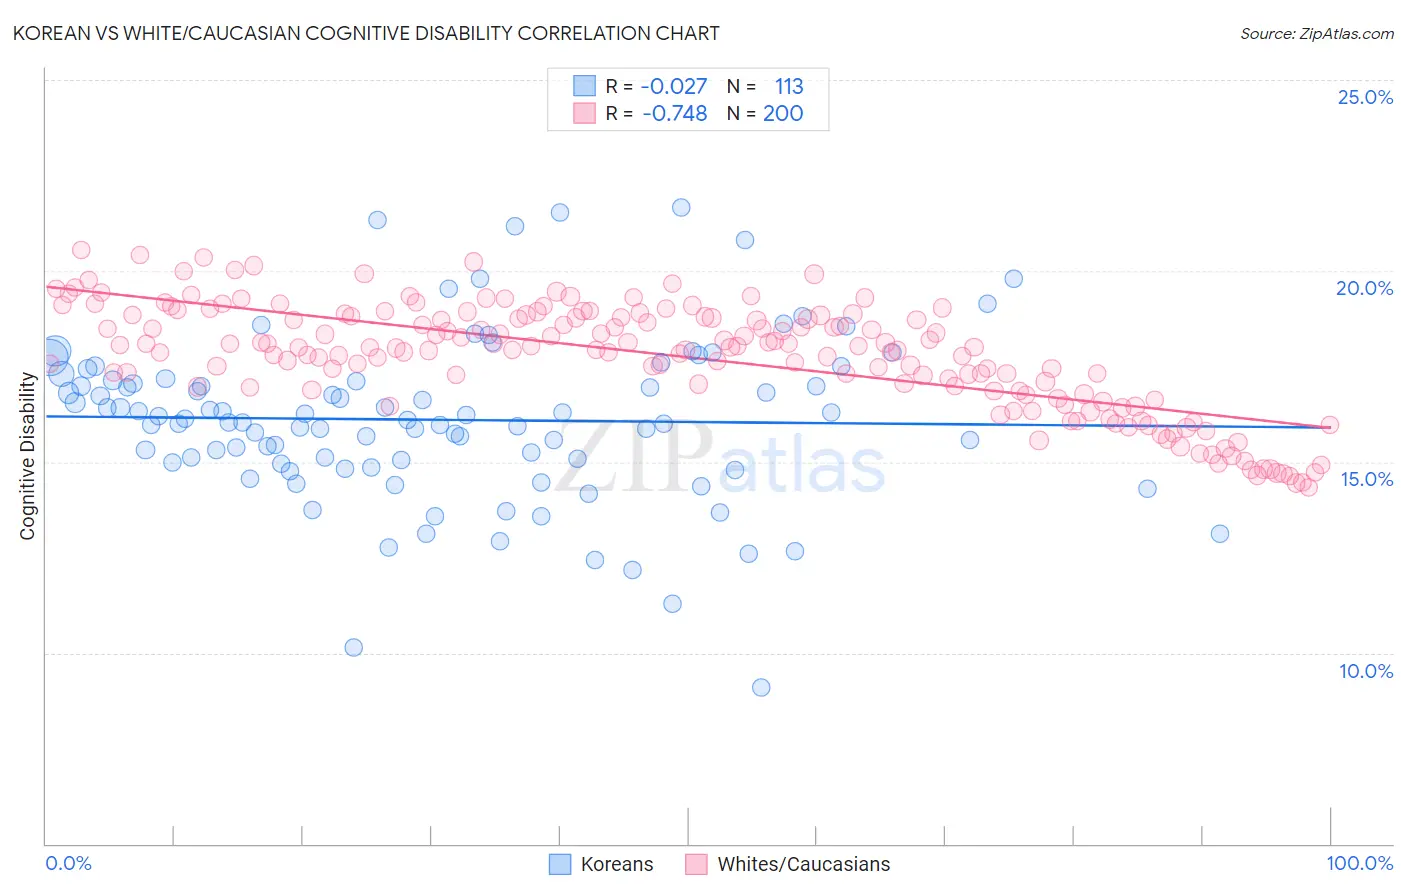
Korean vs White/Caucasian Cognitive Disability Correlation Chart
The statistical analysis conducted on geographies consisting of 510,841,440 people shows no correlation between the proportion of Koreans and percentage of population with cognitive disability in the United States with a correlation coefficient (R) of -0.027 and weighted average of 16.8%. Similarly, the statistical analysis conducted on geographies consisting of 584,856,433 people shows a strong negative correlation between the proportion of Whites/Caucasians and percentage of population with cognitive disability in the United States with a correlation coefficient (R) of -0.748 and weighted average of 17.0%, a difference of 0.77%.
Cognitive Disability Correlation Summary
| Measurement | Korean | White/Caucasian |
| Minimum | 9.1% | 14.3% |
| Maximum | 21.7% | 20.5% |
| Range | 12.6% | 6.2% |
| Mean | 16.1% | 17.7% |
| Median | 16.1% | 18.0% |
| Interquartile 25% (IQ1) | 15.0% | 16.9% |
| Interquartile 75% (IQ3) | 17.2% | 18.8% |
| Interquartile Range (IQR) | 2.2% | 1.9% |
| Standard Deviation (Sample) | 2.2% | 1.4% |
| Standard Deviation (Population) | 2.2% | 1.4% |
Demographics Similar to Koreans and Whites/Caucasians by Cognitive Disability
In terms of cognitive disability, the demographic groups most similar to Koreans are Immigrants from Sri Lanka (16.8%, a difference of 0.0%), Yup'ik (16.9%, a difference of 0.050%), Inupiat (16.9%, a difference of 0.15%), Immigrants from Japan (16.9%, a difference of 0.20%), and Immigrants from Denmark (16.9%, a difference of 0.21%). Similarly, the demographic groups most similar to Whites/Caucasians are Immigrants from Germany (17.0%, a difference of 0.0%), Immigrants from Vietnam (17.0%, a difference of 0.020%), Immigrants from Jordan (17.0%, a difference of 0.030%), Immigrants from Uruguay (17.0%, a difference of 0.080%), and Nicaraguan (17.0%, a difference of 0.090%).
| Demographics | Rating | Rank | Cognitive Disability |
| Immigrants | Sri Lanka | 97.1 /100 | #113 | Exceptional 16.8% |
| Koreans | 97.1 /100 | #114 | Exceptional 16.8% |
| Yup'ik | 96.9 /100 | #115 | Exceptional 16.9% |
| Inupiat | 96.5 /100 | #116 | Exceptional 16.9% |
| Immigrants | Japan | 96.2 /100 | #117 | Exceptional 16.9% |
| Immigrants | Denmark | 96.2 /100 | #118 | Exceptional 16.9% |
| South Africans | 95.5 /100 | #119 | Exceptional 16.9% |
| Scottish | 95.0 /100 | #120 | Exceptional 16.9% |
| Immigrants | China | 94.9 /100 | #121 | Exceptional 16.9% |
| Immigrants | Western Europe | 94.8 /100 | #122 | Exceptional 16.9% |
| Portuguese | 94.7 /100 | #123 | Exceptional 16.9% |
| Turks | 94.5 /100 | #124 | Exceptional 16.9% |
| Scandinavians | 94.1 /100 | #125 | Exceptional 16.9% |
| Europeans | 93.4 /100 | #126 | Exceptional 17.0% |
| Immigrants | Costa Rica | 93.1 /100 | #127 | Exceptional 17.0% |
| Nicaraguans | 93.0 /100 | #128 | Exceptional 17.0% |
| Immigrants | Uruguay | 92.9 /100 | #129 | Exceptional 17.0% |
| Immigrants | Vietnam | 92.4 /100 | #130 | Exceptional 17.0% |
| Immigrants | Germany | 92.1 /100 | #131 | Exceptional 17.0% |
| Whites/Caucasians | 92.1 /100 | #132 | Exceptional 17.0% |
| Immigrants | Jordan | 91.9 /100 | #133 | Exceptional 17.0% |