Romanian vs White/Caucasian Householder Income Ages 45 - 64 years
COMPARE
Romanian
White/Caucasian
Householder Income Ages 45 - 64 years
Householder Income Ages 45 - 64 years Comparison
Romanians
Whites/Caucasians
$108,609
HOUSEHOLDER INCOME AGES 45 - 64 YEARS
98.5/ 100
METRIC RATING
88th/ 347
METRIC RANK
$98,091
HOUSEHOLDER INCOME AGES 45 - 64 YEARS
24.6/ 100
METRIC RATING
199th/ 347
METRIC RANK
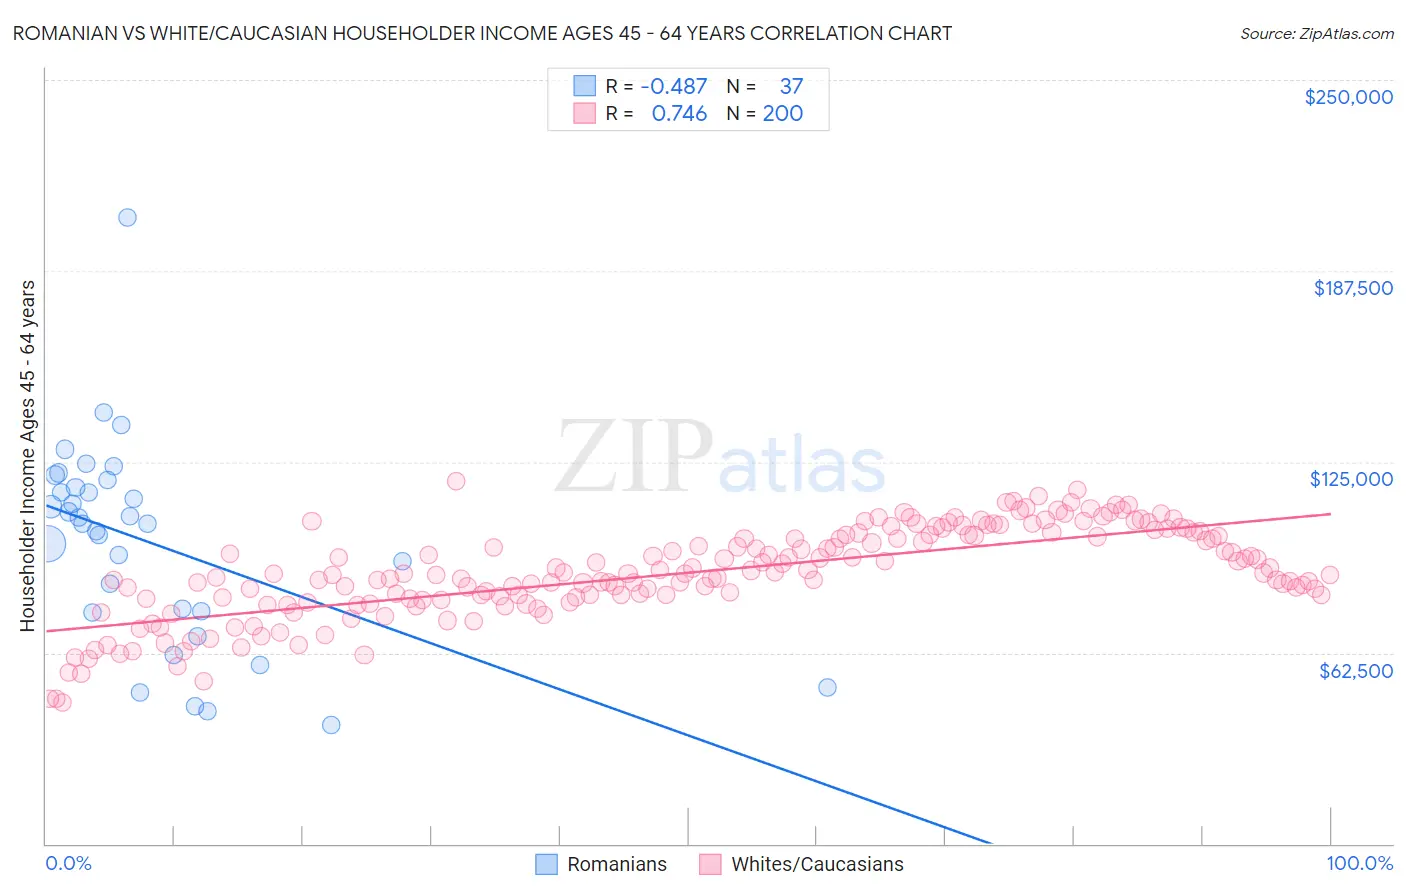
Romanian vs White/Caucasian Householder Income Ages 45 - 64 years Correlation Chart
The statistical analysis conducted on geographies consisting of 377,316,038 people shows a moderate negative correlation between the proportion of Romanians and household income with householder between the ages 45 and 64 in the United States with a correlation coefficient (R) of -0.487 and weighted average of $108,609. Similarly, the statistical analysis conducted on geographies consisting of 579,240,232 people shows a strong positive correlation between the proportion of Whites/Caucasians and household income with householder between the ages 45 and 64 in the United States with a correlation coefficient (R) of 0.746 and weighted average of $98,091, a difference of 10.7%.
Householder Income Ages 45 - 64 years Correlation Summary
| Measurement | Romanian | White/Caucasian |
| Minimum | $38,906 | $46,068 |
| Maximum | $205,179 | $118,717 |
| Range | $166,273 | $72,649 |
| Mean | $98,730 | $88,743 |
| Median | $104,735 | $88,408 |
| Interquartile 25% (IQ1) | $75,908 | $80,288 |
| Interquartile 75% (IQ3) | $117,732 | $101,075 |
| Interquartile Range (IQR) | $41,823 | $20,787 |
| Standard Deviation (Sample) | $33,257 | $14,868 |
| Standard Deviation (Population) | $32,804 | $14,830 |
Similar Demographics by Householder Income Ages 45 - 64 years
Demographics Similar to Romanians by Householder Income Ages 45 - 64 years
In terms of householder income ages 45 - 64 years, the demographic groups most similar to Romanians are Tongan ($108,643, a difference of 0.030%), Austrian ($108,692, a difference of 0.080%), Ukrainian ($108,475, a difference of 0.12%), Immigrants from Philippines ($108,471, a difference of 0.13%), and Immigrants from Lebanon ($108,471, a difference of 0.13%).
| Demographics | Rating | Rank | Householder Income Ages 45 - 64 years |
| Immigrants | Eastern Europe | 98.9 /100 | #81 | Exceptional $109,335 |
| Immigrants | North America | 98.8 /100 | #82 | Exceptional $109,198 |
| Immigrants | Spain | 98.8 /100 | #83 | Exceptional $109,051 |
| Immigrants | Western Europe | 98.6 /100 | #84 | Exceptional $108,824 |
| Immigrants | Afghanistan | 98.6 /100 | #85 | Exceptional $108,785 |
| Austrians | 98.5 /100 | #86 | Exceptional $108,692 |
| Tongans | 98.5 /100 | #87 | Exceptional $108,643 |
| Romanians | 98.5 /100 | #88 | Exceptional $108,609 |
| Ukrainians | 98.3 /100 | #89 | Exceptional $108,475 |
| Immigrants | Philippines | 98.3 /100 | #90 | Exceptional $108,471 |
| Immigrants | Lebanon | 98.3 /100 | #91 | Exceptional $108,471 |
| Croatians | 98.3 /100 | #92 | Exceptional $108,383 |
| Immigrants | Croatia | 98.2 /100 | #93 | Exceptional $108,304 |
| Sri Lankans | 98.2 /100 | #94 | Exceptional $108,270 |
| Immigrants | Hungary | 98.2 /100 | #95 | Exceptional $108,267 |
Demographics Similar to Whites/Caucasians by Householder Income Ages 45 - 64 years
In terms of householder income ages 45 - 64 years, the demographic groups most similar to Whites/Caucasians are Immigrants from Iraq ($98,201, a difference of 0.11%), Immigrants from Kenya ($97,964, a difference of 0.13%), Puget Sound Salish ($98,340, a difference of 0.25%), Immigrants from Eastern Africa ($98,467, a difference of 0.38%), and Spanish ($98,554, a difference of 0.47%).
| Demographics | Rating | Rank | Householder Income Ages 45 - 64 years |
| Celtics | 32.9 /100 | #192 | Fair $98,896 |
| Hawaiians | 31.6 /100 | #193 | Fair $98,778 |
| Uruguayans | 30.3 /100 | #194 | Fair $98,660 |
| Spanish | 29.2 /100 | #195 | Fair $98,554 |
| Immigrants | Eastern Africa | 28.3 /100 | #196 | Fair $98,467 |
| Puget Sound Salish | 27.0 /100 | #197 | Fair $98,340 |
| Immigrants | Iraq | 25.7 /100 | #198 | Fair $98,201 |
| Whites/Caucasians | 24.6 /100 | #199 | Fair $98,091 |
| Immigrants | Kenya | 23.5 /100 | #200 | Fair $97,964 |
| Yugoslavians | 20.0 /100 | #201 | Fair $97,558 |
| Tlingit-Haida | 18.9 /100 | #202 | Poor $97,417 |
| Immigrants | Thailand | 18.8 /100 | #203 | Poor $97,400 |
| Immigrants | Eritrea | 18.6 /100 | #204 | Poor $97,373 |
| Immigrants | Colombia | 18.0 /100 | #205 | Poor $97,290 |
| Immigrants | Africa | 17.9 /100 | #206 | Poor $97,284 |