Immigrants from Guatemala vs White/Caucasian Householder Income Ages 45 - 64 years
COMPARE
Immigrants from Guatemala
White/Caucasian
Householder Income Ages 45 - 64 years
Householder Income Ages 45 - 64 years Comparison
Immigrants from Guatemala
Whites/Caucasians
$86,573
HOUSEHOLDER INCOME AGES 45 - 64 YEARS
0.1/ 100
METRIC RATING
286th/ 347
METRIC RANK
$98,091
HOUSEHOLDER INCOME AGES 45 - 64 YEARS
24.6/ 100
METRIC RATING
199th/ 347
METRIC RANK
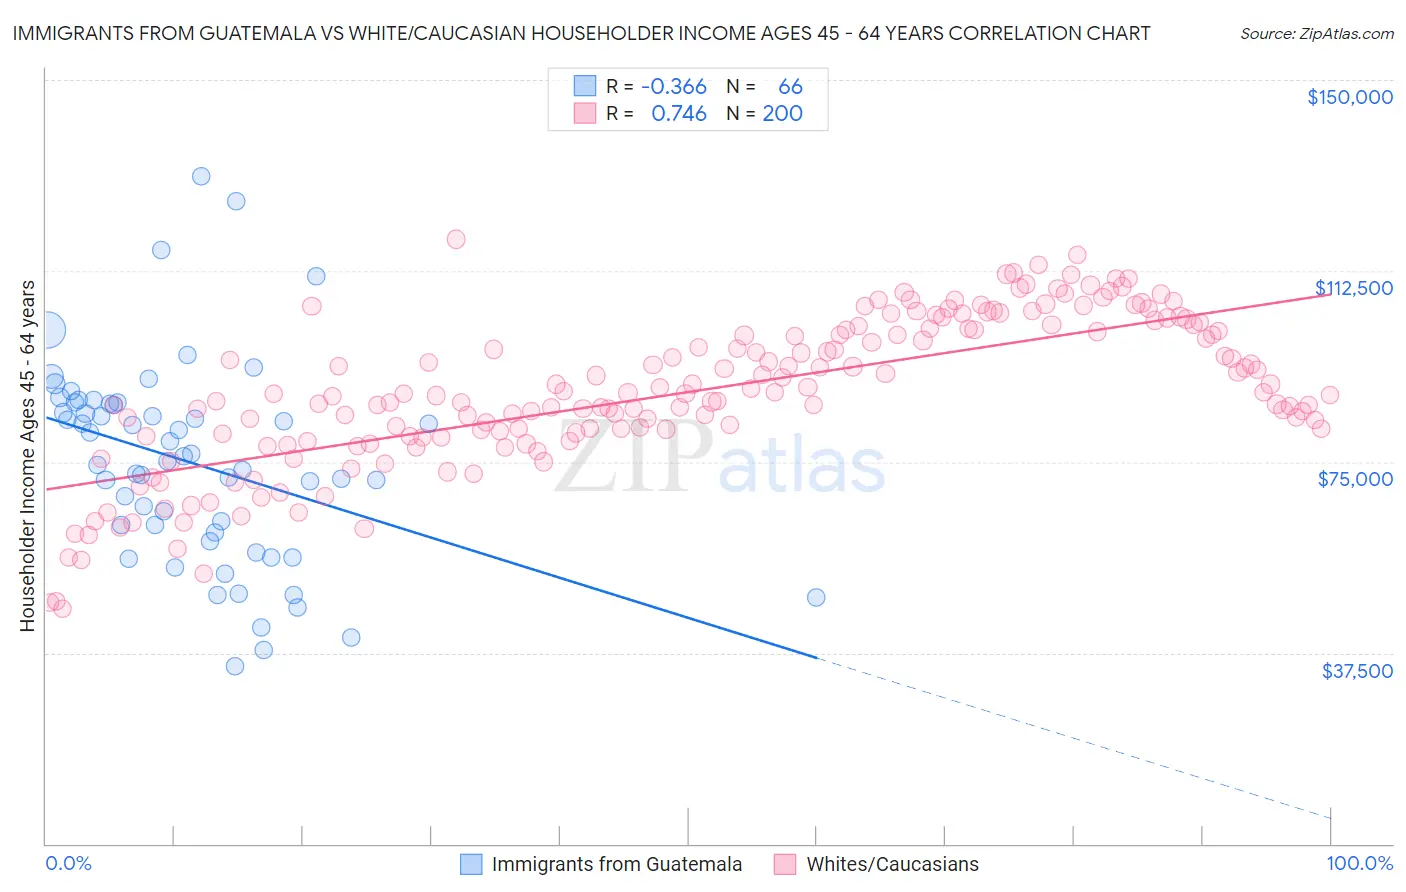
Immigrants from Guatemala vs White/Caucasian Householder Income Ages 45 - 64 years Correlation Chart
The statistical analysis conducted on geographies consisting of 376,817,889 people shows a mild negative correlation between the proportion of Immigrants from Guatemala and household income with householder between the ages 45 and 64 in the United States with a correlation coefficient (R) of -0.366 and weighted average of $86,573. Similarly, the statistical analysis conducted on geographies consisting of 579,240,232 people shows a strong positive correlation between the proportion of Whites/Caucasians and household income with householder between the ages 45 and 64 in the United States with a correlation coefficient (R) of 0.746 and weighted average of $98,091, a difference of 13.3%.
Householder Income Ages 45 - 64 years Correlation Summary
| Measurement | Immigrants from Guatemala | White/Caucasian |
| Minimum | $34,910 | $46,068 |
| Maximum | $131,185 | $118,717 |
| Range | $96,275 | $72,649 |
| Mean | $74,838 | $88,743 |
| Median | $75,675 | $88,408 |
| Interquartile 25% (IQ1) | $61,091 | $80,288 |
| Interquartile 75% (IQ3) | $86,426 | $101,075 |
| Interquartile Range (IQR) | $25,336 | $20,787 |
| Standard Deviation (Sample) | $19,729 | $14,868 |
| Standard Deviation (Population) | $19,579 | $14,830 |
Similar Demographics by Householder Income Ages 45 - 64 years
Demographics Similar to Immigrants from Guatemala by Householder Income Ages 45 - 64 years
In terms of householder income ages 45 - 64 years, the demographic groups most similar to Immigrants from Guatemala are Blackfeet ($86,595, a difference of 0.030%), Bangladeshi ($86,402, a difference of 0.20%), Immigrants from St. Vincent and the Grenadines ($86,394, a difference of 0.21%), Central American Indian ($86,764, a difference of 0.22%), and Mexican ($86,816, a difference of 0.28%).
| Demographics | Rating | Rank | Householder Income Ages 45 - 64 years |
| Yakama | 0.1 /100 | #279 | Tragic $86,992 |
| Immigrants | Somalia | 0.1 /100 | #280 | Tragic $86,987 |
| Yaqui | 0.1 /100 | #281 | Tragic $86,914 |
| Senegalese | 0.1 /100 | #282 | Tragic $86,897 |
| Mexicans | 0.1 /100 | #283 | Tragic $86,816 |
| Central American Indians | 0.1 /100 | #284 | Tragic $86,764 |
| Blackfeet | 0.1 /100 | #285 | Tragic $86,595 |
| Immigrants | Guatemala | 0.1 /100 | #286 | Tragic $86,573 |
| Bangladeshis | 0.1 /100 | #287 | Tragic $86,402 |
| Immigrants | St. Vincent and the Grenadines | 0.1 /100 | #288 | Tragic $86,394 |
| Cubans | 0.1 /100 | #289 | Tragic $86,301 |
| Cherokee | 0.1 /100 | #290 | Tragic $86,125 |
| Hispanics or Latinos | 0.1 /100 | #291 | Tragic $86,006 |
| Immigrants | Central America | 0.1 /100 | #292 | Tragic $85,965 |
| Comanche | 0.1 /100 | #293 | Tragic $85,787 |
Demographics Similar to Whites/Caucasians by Householder Income Ages 45 - 64 years
In terms of householder income ages 45 - 64 years, the demographic groups most similar to Whites/Caucasians are Immigrants from Iraq ($98,201, a difference of 0.11%), Immigrants from Kenya ($97,964, a difference of 0.13%), Puget Sound Salish ($98,340, a difference of 0.25%), Immigrants from Eastern Africa ($98,467, a difference of 0.38%), and Spanish ($98,554, a difference of 0.47%).
| Demographics | Rating | Rank | Householder Income Ages 45 - 64 years |
| Celtics | 32.9 /100 | #192 | Fair $98,896 |
| Hawaiians | 31.6 /100 | #193 | Fair $98,778 |
| Uruguayans | 30.3 /100 | #194 | Fair $98,660 |
| Spanish | 29.2 /100 | #195 | Fair $98,554 |
| Immigrants | Eastern Africa | 28.3 /100 | #196 | Fair $98,467 |
| Puget Sound Salish | 27.0 /100 | #197 | Fair $98,340 |
| Immigrants | Iraq | 25.7 /100 | #198 | Fair $98,201 |
| Whites/Caucasians | 24.6 /100 | #199 | Fair $98,091 |
| Immigrants | Kenya | 23.5 /100 | #200 | Fair $97,964 |
| Yugoslavians | 20.0 /100 | #201 | Fair $97,558 |
| Tlingit-Haida | 18.9 /100 | #202 | Poor $97,417 |
| Immigrants | Thailand | 18.8 /100 | #203 | Poor $97,400 |
| Immigrants | Eritrea | 18.6 /100 | #204 | Poor $97,373 |
| Immigrants | Colombia | 18.0 /100 | #205 | Poor $97,290 |
| Immigrants | Africa | 17.9 /100 | #206 | Poor $97,284 |