Kiowa vs Colville Per Capita Income
COMPARE
Kiowa
Colville
Per Capita Income
Per Capita Income Comparison
Kiowa
Colville
$35,102
PER CAPITA INCOME
0.0/ 100
METRIC RATING
324th/ 347
METRIC RANK
$38,047
PER CAPITA INCOME
0.2/ 100
METRIC RATING
279th/ 347
METRIC RANK
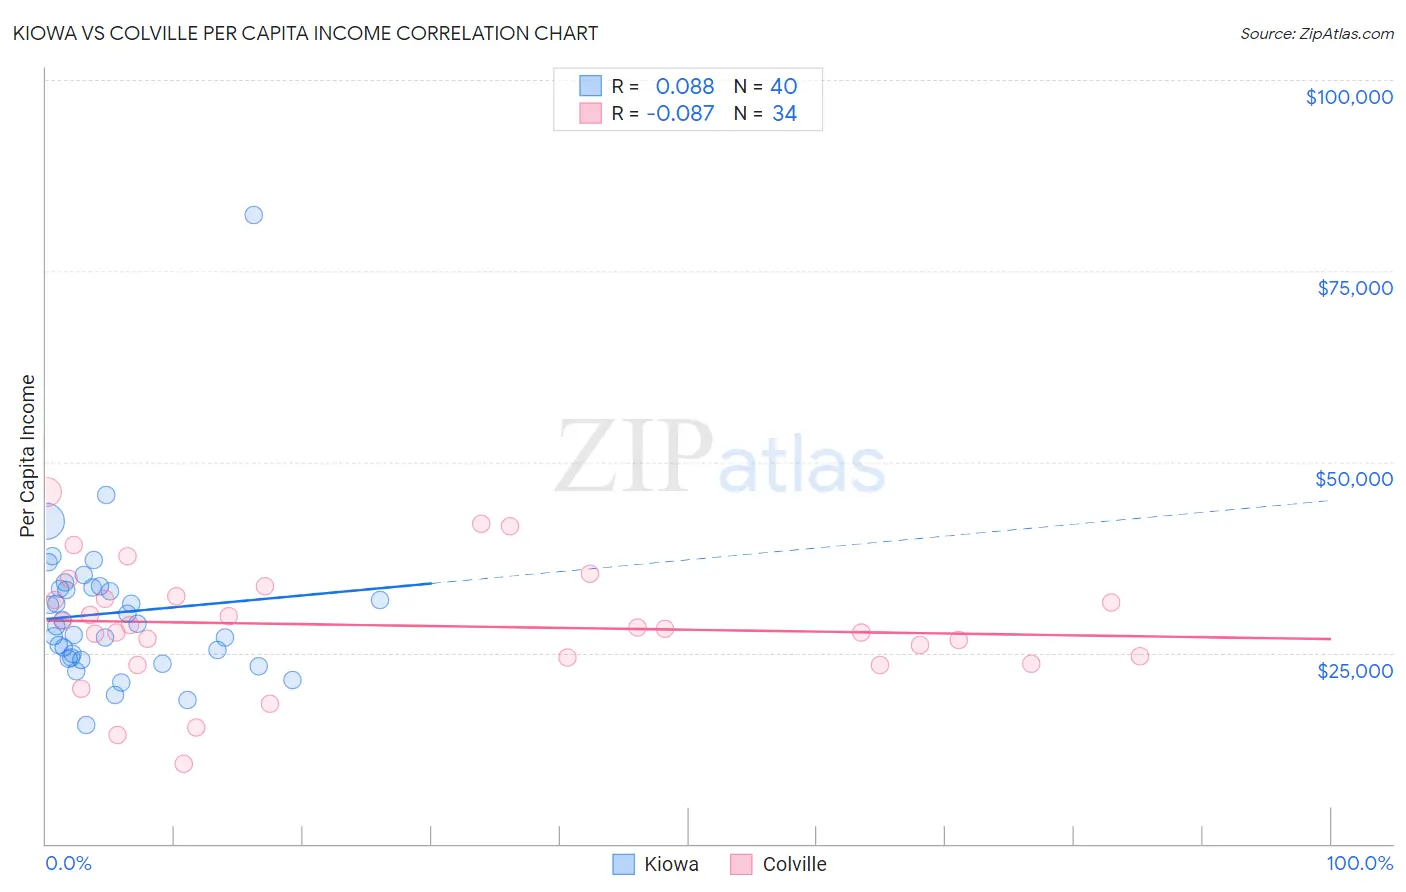
Kiowa vs Colville Per Capita Income Correlation Chart
The statistical analysis conducted on geographies consisting of 56,101,664 people shows a slight positive correlation between the proportion of Kiowa and per capita income in the United States with a correlation coefficient (R) of 0.088 and weighted average of $35,102. Similarly, the statistical analysis conducted on geographies consisting of 34,687,707 people shows a slight negative correlation between the proportion of Colville and per capita income in the United States with a correlation coefficient (R) of -0.087 and weighted average of $38,047, a difference of 8.4%.
Per Capita Income Correlation Summary
| Measurement | Kiowa | Colville |
| Minimum | $15,468 | $10,541 |
| Maximum | $82,387 | $46,065 |
| Range | $66,919 | $35,524 |
| Mean | $30,249 | $28,594 |
| Median | $28,572 | $28,215 |
| Interquartile 25% (IQ1) | $24,302 | $24,418 |
| Interquartile 75% (IQ3) | $33,441 | $32,462 |
| Interquartile Range (IQR) | $9,140 | $8,044 |
| Standard Deviation (Sample) | $10,578 | $7,817 |
| Standard Deviation (Population) | $10,445 | $7,701 |
Similar Demographics by Per Capita Income
Demographics Similar to Kiowa by Per Capita Income
In terms of per capita income, the demographic groups most similar to Kiowa are Immigrants from Central America ($34,974, a difference of 0.37%), Cheyenne ($35,276, a difference of 0.50%), Immigrants from Cuba ($34,910, a difference of 0.55%), Apache ($34,886, a difference of 0.62%), and Creek ($35,546, a difference of 1.3%).
| Demographics | Rating | Rank | Per Capita Income |
| Dutch West Indians | 0.0 /100 | #317 | Tragic $35,922 |
| Bangladeshis | 0.0 /100 | #318 | Tragic $35,897 |
| Immigrants | Congo | 0.0 /100 | #319 | Tragic $35,720 |
| Hispanics or Latinos | 0.0 /100 | #320 | Tragic $35,688 |
| Blacks/African Americans | 0.0 /100 | #321 | Tragic $35,564 |
| Creek | 0.0 /100 | #322 | Tragic $35,546 |
| Cheyenne | 0.0 /100 | #323 | Tragic $35,276 |
| Kiowa | 0.0 /100 | #324 | Tragic $35,102 |
| Immigrants | Central America | 0.0 /100 | #325 | Tragic $34,974 |
| Immigrants | Cuba | 0.0 /100 | #326 | Tragic $34,910 |
| Apache | 0.0 /100 | #327 | Tragic $34,886 |
| Menominee | 0.0 /100 | #328 | Tragic $34,578 |
| Mexicans | 0.0 /100 | #329 | Tragic $34,559 |
| Spanish American Indians | 0.0 /100 | #330 | Tragic $34,195 |
| Immigrants | Mexico | 0.0 /100 | #331 | Tragic $33,931 |
Demographics Similar to Colville by Per Capita Income
In terms of per capita income, the demographic groups most similar to Colville are Potawatomi ($38,046, a difference of 0.0%), Immigrants from Nicaragua ($38,065, a difference of 0.050%), Comanche ($38,088, a difference of 0.11%), Hmong ($38,120, a difference of 0.19%), and Immigrants from Dominica ($37,952, a difference of 0.25%).
| Demographics | Rating | Rank | Per Capita Income |
| Immigrants | Cabo Verde | 0.3 /100 | #272 | Tragic $38,540 |
| Nepalese | 0.3 /100 | #273 | Tragic $38,442 |
| Immigrants | El Salvador | 0.3 /100 | #274 | Tragic $38,394 |
| Immigrants | Liberia | 0.2 /100 | #275 | Tragic $38,165 |
| Hmong | 0.2 /100 | #276 | Tragic $38,120 |
| Comanche | 0.2 /100 | #277 | Tragic $38,088 |
| Immigrants | Nicaragua | 0.2 /100 | #278 | Tragic $38,065 |
| Colville | 0.2 /100 | #279 | Tragic $38,047 |
| Potawatomi | 0.2 /100 | #280 | Tragic $38,046 |
| Immigrants | Dominica | 0.2 /100 | #281 | Tragic $37,952 |
| Immigrants | Laos | 0.1 /100 | #282 | Tragic $37,857 |
| Pennsylvania Germans | 0.1 /100 | #283 | Tragic $37,842 |
| Africans | 0.1 /100 | #284 | Tragic $37,785 |
| Guatemalans | 0.1 /100 | #285 | Tragic $37,766 |
| Central American Indians | 0.1 /100 | #286 | Tragic $37,699 |