Jamaican vs Trinidadian and Tobagonian Median Male Earnings
COMPARE
Jamaican
Trinidadian and Tobagonian
Median Male Earnings
Median Male Earnings Comparison
Jamaicans
Trinidadians and Tobagonians
$48,632
MEDIAN MALE EARNINGS
0.3/ 100
METRIC RATING
273rd/ 347
METRIC RANK
$51,446
MEDIAN MALE EARNINGS
4.8/ 100
METRIC RATING
227th/ 347
METRIC RANK
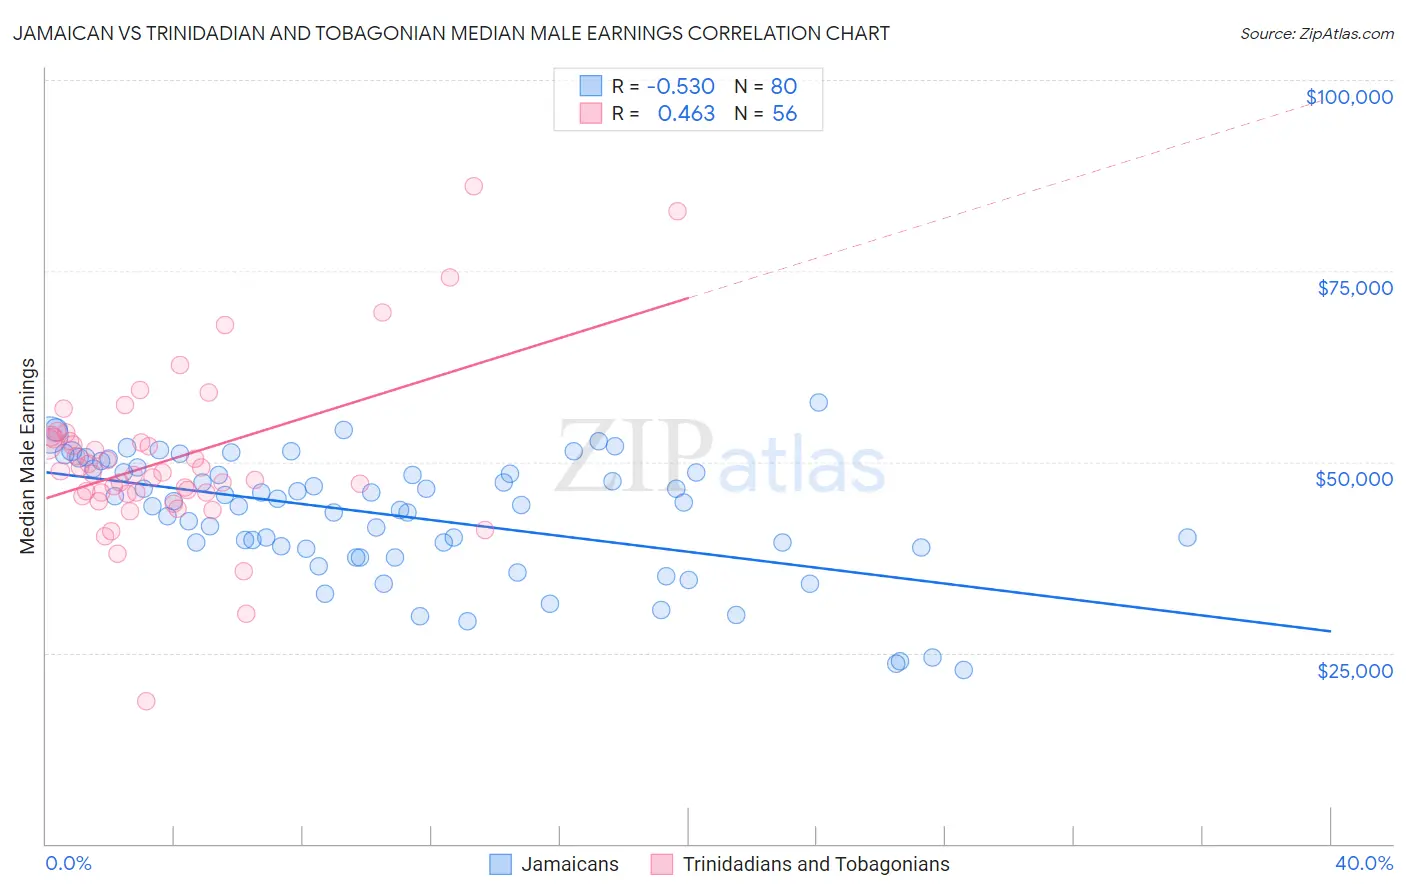
Jamaican vs Trinidadian and Tobagonian Median Male Earnings Correlation Chart
The statistical analysis conducted on geographies consisting of 367,962,773 people shows a substantial negative correlation between the proportion of Jamaicans and median male earnings in the United States with a correlation coefficient (R) of -0.530 and weighted average of $48,632. Similarly, the statistical analysis conducted on geographies consisting of 219,852,286 people shows a moderate positive correlation between the proportion of Trinidadians and Tobagonians and median male earnings in the United States with a correlation coefficient (R) of 0.463 and weighted average of $51,446, a difference of 5.8%.
Median Male Earnings Correlation Summary
| Measurement | Jamaican | Trinidadian and Tobagonian |
| Minimum | $22,747 | $18,666 |
| Maximum | $57,769 | $86,046 |
| Range | $35,022 | $67,380 |
| Mean | $42,945 | $50,279 |
| Median | $44,504 | $48,562 |
| Interquartile 25% (IQ1) | $38,662 | $45,885 |
| Interquartile 75% (IQ3) | $48,891 | $52,942 |
| Interquartile Range (IQR) | $10,229 | $7,058 |
| Standard Deviation (Sample) | $7,942 | $10,888 |
| Standard Deviation (Population) | $7,893 | $10,790 |
Similar Demographics by Median Male Earnings
Demographics Similar to Jamaicans by Median Male Earnings
In terms of median male earnings, the demographic groups most similar to Jamaicans are Salvadoran ($48,646, a difference of 0.030%), Cherokee ($48,669, a difference of 0.080%), Colville ($48,516, a difference of 0.24%), Potawatomi ($48,768, a difference of 0.28%), and Immigrants from Somalia ($48,439, a difference of 0.40%).
| Demographics | Rating | Rank | Median Male Earnings |
| Somalis | 0.5 /100 | #266 | Tragic $49,025 |
| Spanish Americans | 0.5 /100 | #267 | Tragic $49,008 |
| Ute | 0.4 /100 | #268 | Tragic $48,899 |
| Tsimshian | 0.4 /100 | #269 | Tragic $48,836 |
| Potawatomi | 0.4 /100 | #270 | Tragic $48,768 |
| Cherokee | 0.3 /100 | #271 | Tragic $48,669 |
| Salvadorans | 0.3 /100 | #272 | Tragic $48,646 |
| Jamaicans | 0.3 /100 | #273 | Tragic $48,632 |
| Colville | 0.3 /100 | #274 | Tragic $48,516 |
| Immigrants | Somalia | 0.3 /100 | #275 | Tragic $48,439 |
| Blackfeet | 0.3 /100 | #276 | Tragic $48,402 |
| Belizeans | 0.2 /100 | #277 | Tragic $48,358 |
| Immigrants | Liberia | 0.2 /100 | #278 | Tragic $48,317 |
| Hmong | 0.2 /100 | #279 | Tragic $48,254 |
| Comanche | 0.2 /100 | #280 | Tragic $48,202 |
Demographics Similar to Trinidadians and Tobagonians by Median Male Earnings
In terms of median male earnings, the demographic groups most similar to Trinidadians and Tobagonians are Japanese ($51,473, a difference of 0.050%), Immigrants from Sudan ($51,489, a difference of 0.080%), Samoan ($51,389, a difference of 0.11%), Immigrants from Trinidad and Tobago ($51,376, a difference of 0.14%), and Immigrants from Nigeria ($51,310, a difference of 0.27%).
| Demographics | Rating | Rank | Median Male Earnings |
| Immigrants | Armenia | 6.6 /100 | #220 | Tragic $51,793 |
| Immigrants | Senegal | 5.8 /100 | #221 | Tragic $51,647 |
| Immigrants | Bangladesh | 5.8 /100 | #222 | Tragic $51,642 |
| Ecuadorians | 5.5 /100 | #223 | Tragic $51,596 |
| Immigrants | Cambodia | 5.5 /100 | #224 | Tragic $51,594 |
| Immigrants | Sudan | 5.0 /100 | #225 | Tragic $51,489 |
| Japanese | 4.9 /100 | #226 | Tragic $51,473 |
| Trinidadians and Tobagonians | 4.8 /100 | #227 | Tragic $51,446 |
| Samoans | 4.6 /100 | #228 | Tragic $51,389 |
| Immigrants | Trinidad and Tobago | 4.5 /100 | #229 | Tragic $51,376 |
| Immigrants | Nigeria | 4.2 /100 | #230 | Tragic $51,310 |
| Barbadians | 3.9 /100 | #231 | Tragic $51,236 |
| Sudanese | 3.9 /100 | #232 | Tragic $51,216 |
| Aleuts | 3.7 /100 | #233 | Tragic $51,168 |
| Cape Verdeans | 3.5 /100 | #234 | Tragic $51,103 |